 @idiosyncratic1
more from that month
@idiosyncratic1
more from that month
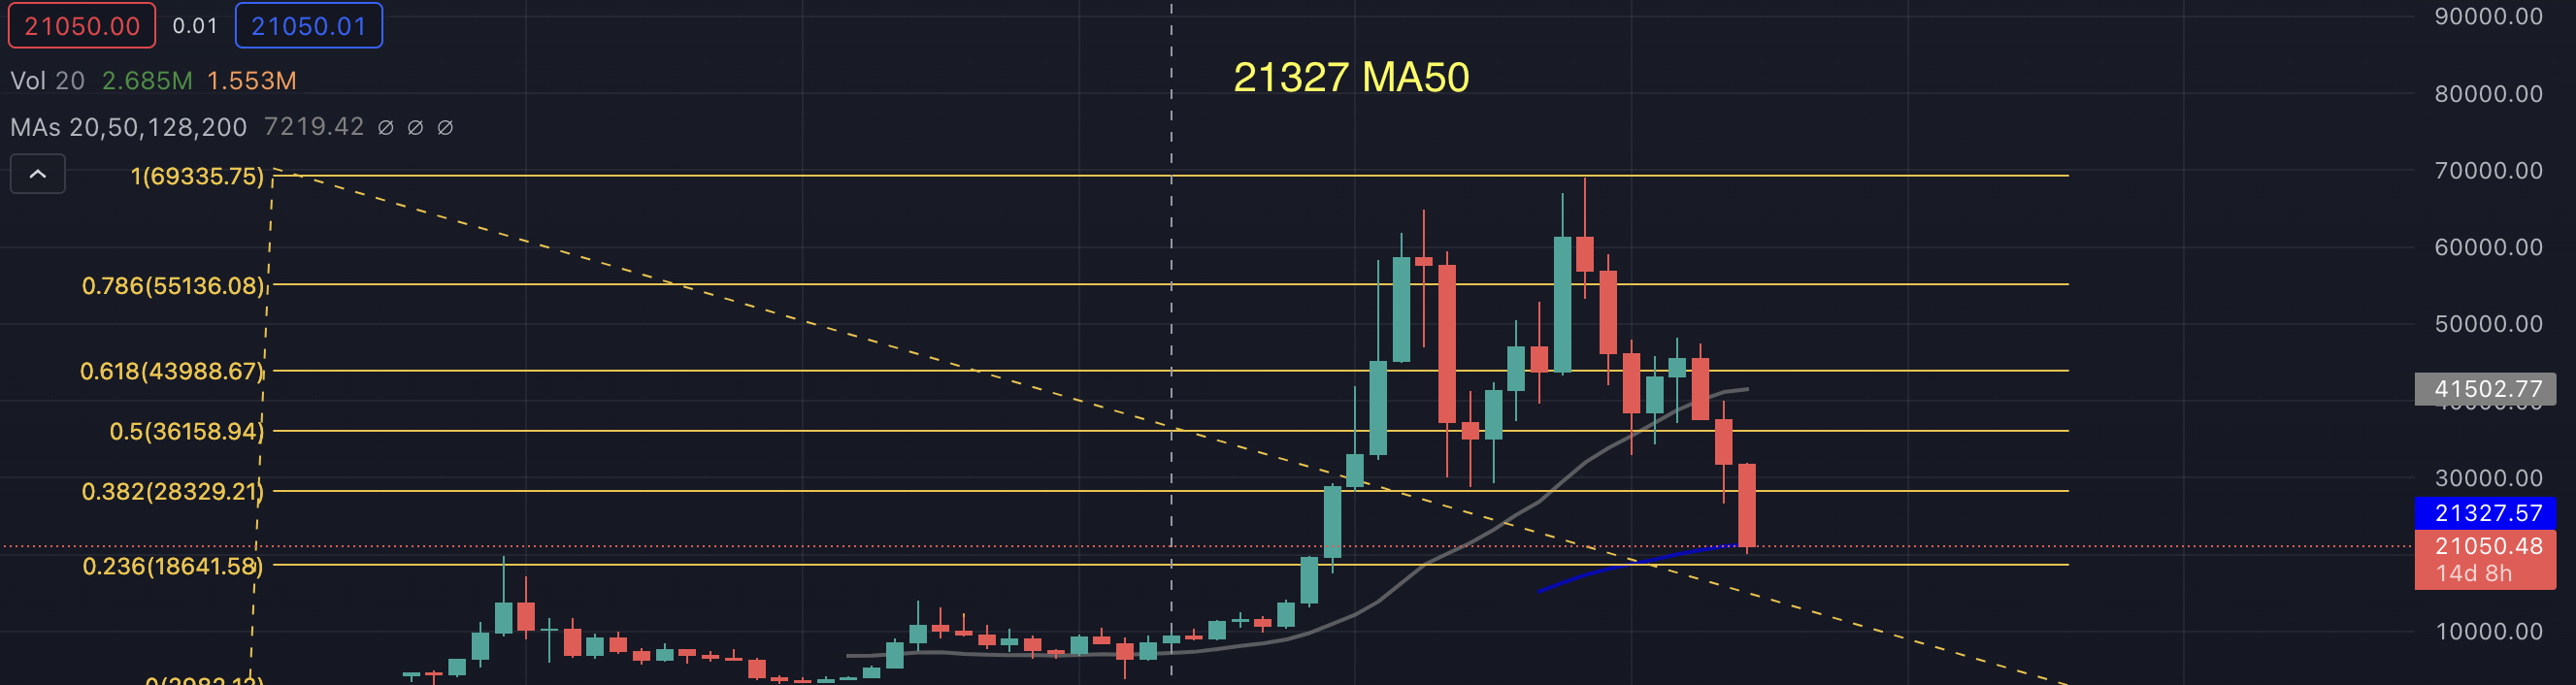
MA50 Support for Bitcoin Weekly Chart As you can see below, the blue line represents 50 weeks of moving average for the #Bitcoin chart. It shows that above 21300 can be a support for Bitcoin if the whole #crypto market does not go down due to some global reasons. Even though I would not be surprised If I see below 17K, I'm taking risks by adding some #BTC to my crypto portfolio. Yet, it will be at most 20% of my budget ^^
No comments yet