龍家俊教你 機器學習 day15 #Matplotlib之HelloWorld import matplotlib.pyplot as plt # 1.創建畫布 plt.figure(figsize=(10, 10), dpi=100) # 2.繪製折線圖 plt.plot([1, 2, 3, 4, 5, 6 ,7], [20,17,18,16,11,11,18]) # 3.顯示圖像 plt.show()
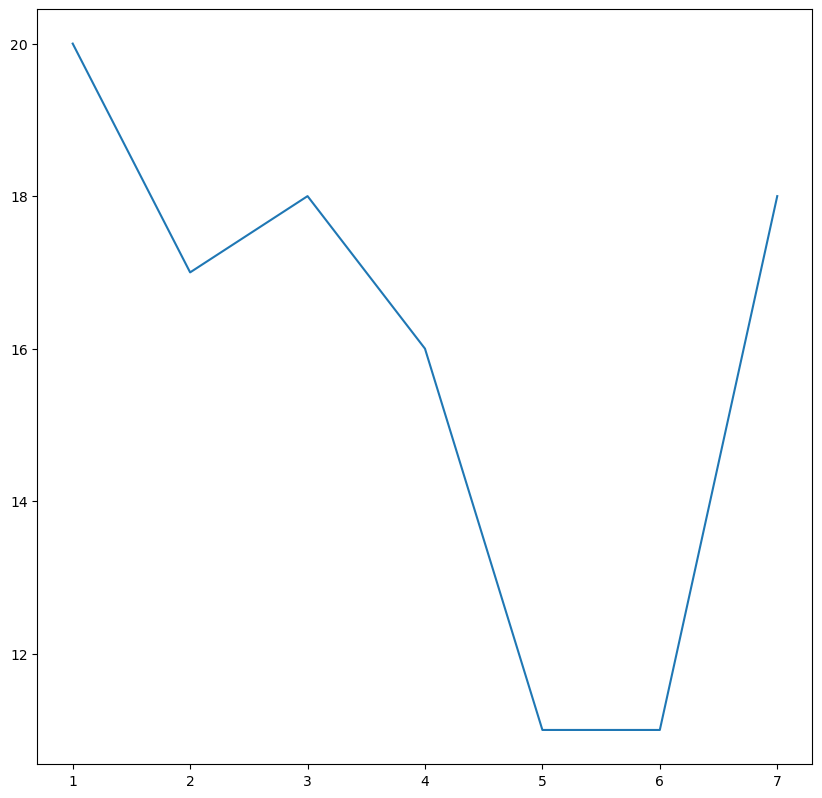
龍家俊教你 機器學習 day15 #Matplotlib之HelloWorld import matplotlib.pyplot as plt # 1.創建畫布 plt.figure(figsize=(10, 10), dpi=100) # 2.繪製折線圖 plt.plot([1, 2, 3, 4, 5, 6 ,7], [20,17,18,16,11,11,18]) # 3.顯示圖像 plt.show()
Log in to join in Reading is open to everyone. Replying needs an account.
No comments yet