 @francis105d1
edited
more from that month
@francis105d1
edited
more from that month
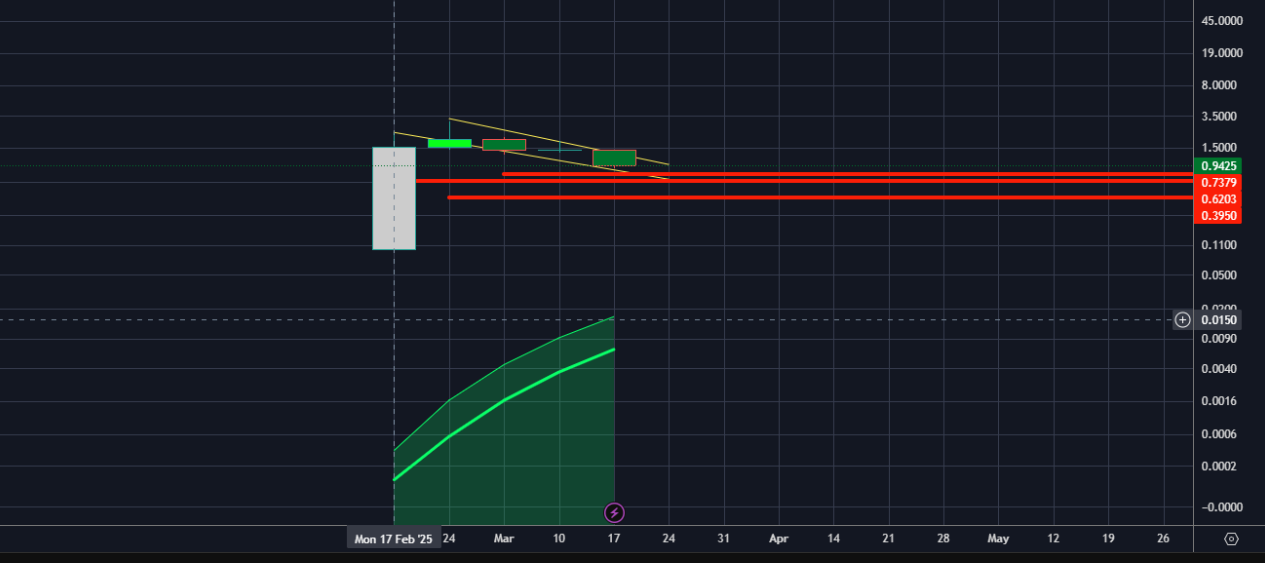
Pi Network at a Crossroads: Will the Downtrend Continue or Reverse? I will ask you to support me by donating some Pi, @francis105d1. Pi Network is currently facing a significant downtrend, and if the price fails to recover, further losses could be on the horizon. The 4-hour and daily charts reveal a flag pattern, indicating that the price could break in either direction. The upper boundary of the flag is around $1.20, though this level will adjust as new candles form. Meanwhile, key support rests near $0.70.
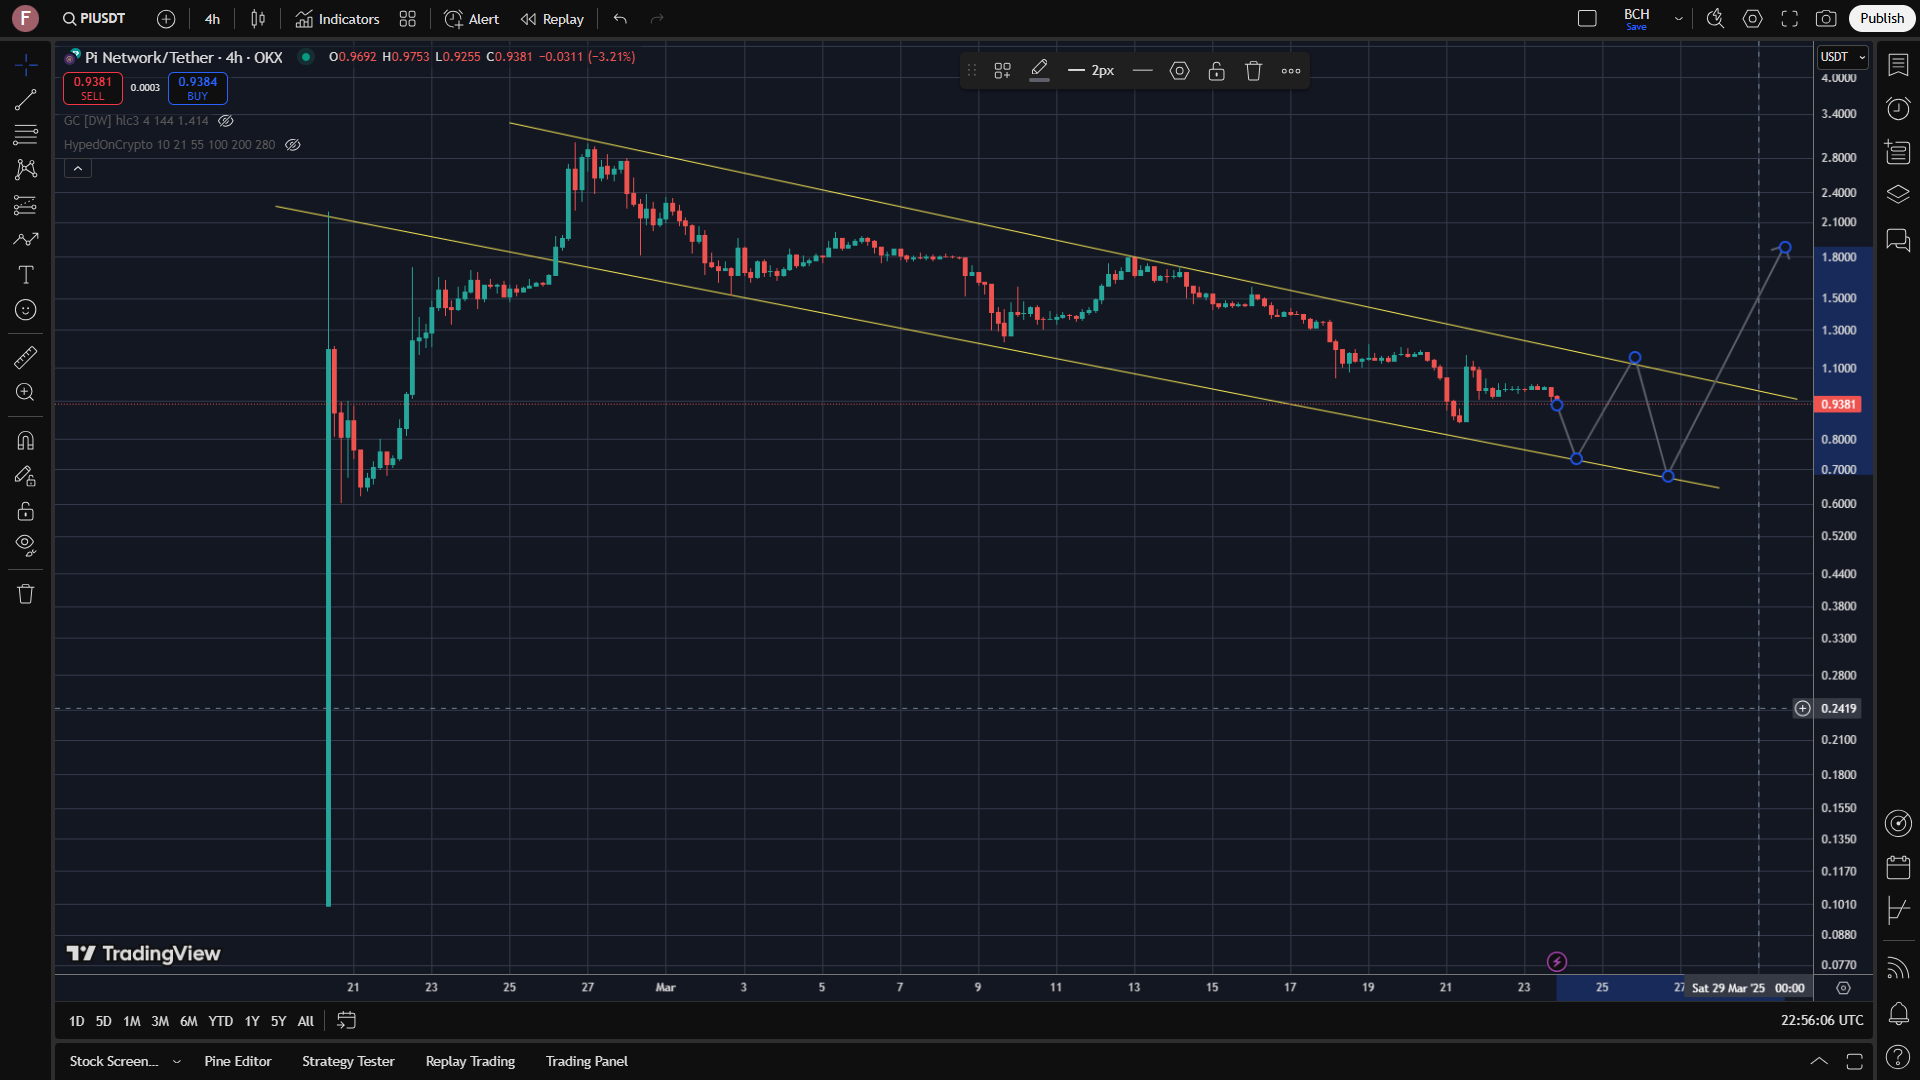
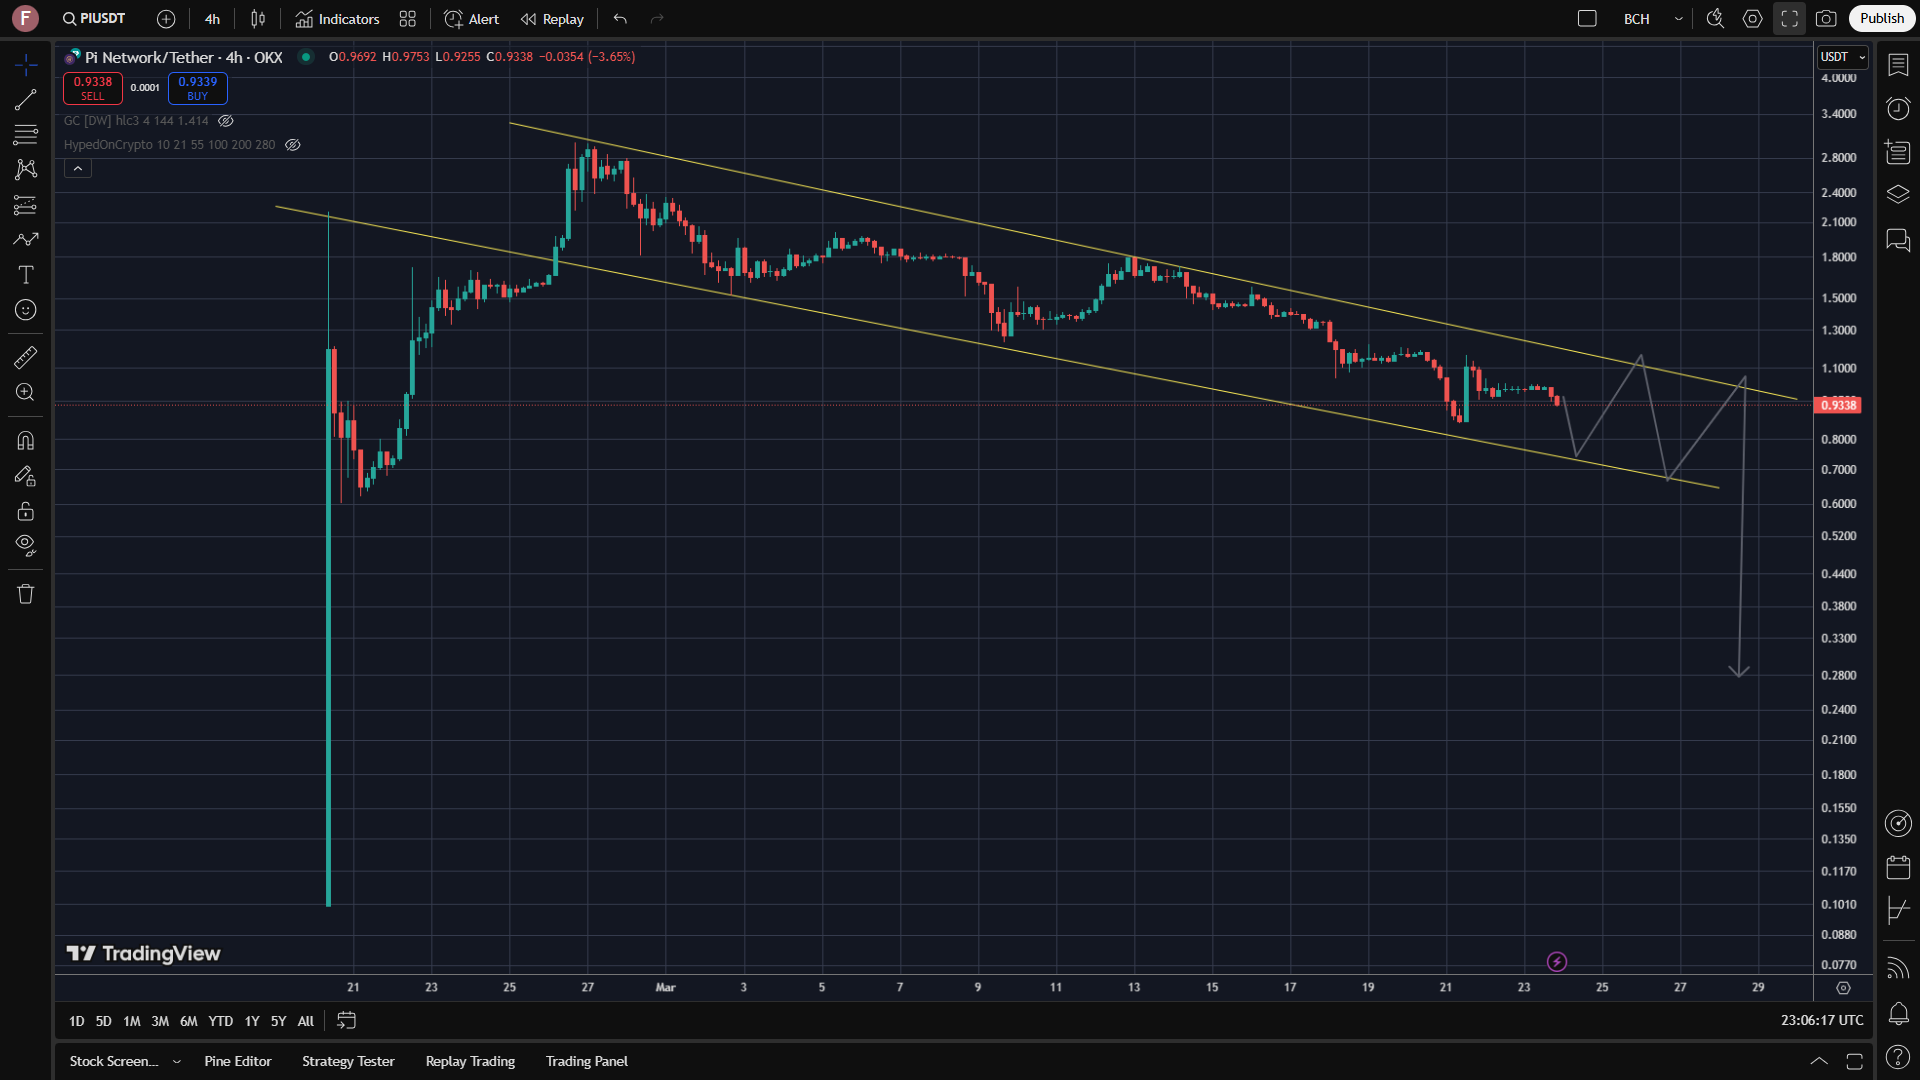
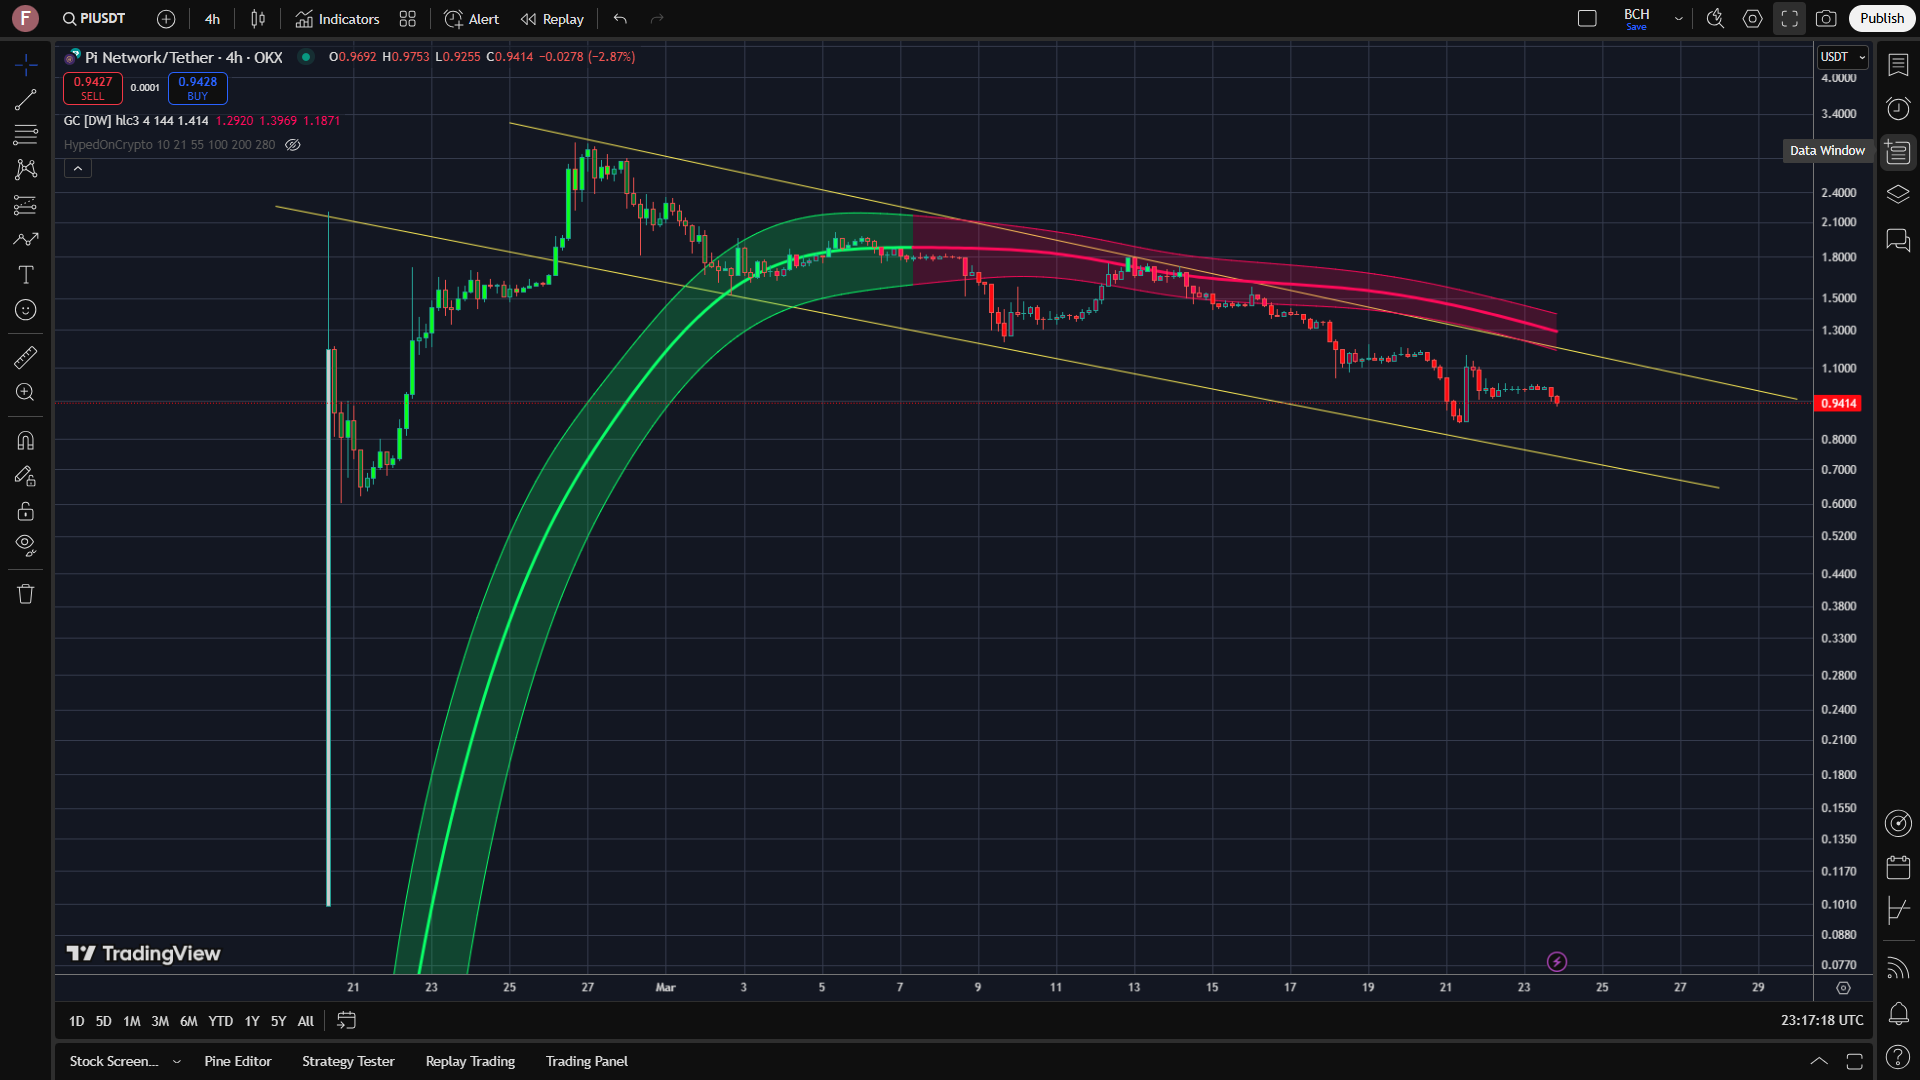
If the price breaks upward, it could re-establish a bullish Gaussian channel once multiple 4-hour candles close above $1.20. However, the Gaussian channel remains bearish on the 4-hour chart, signaling potential downside pressure that could extend into the daily chart.
In the daily timeframe, if a candle closes below the Gaussian channel, it may confirm a deeper downtrend with mid-to-long-term implications. If the flag formation and Gaussian channel fail to hold as support, the next significant price floor will be determined by the weekly Gaussian channel. Currently, this ultimate support level suggests a price near $0.01, though reaching this level would require several consecutive bearish daily candles. **Key Support Levels to Watch** The daily chart currently has four major support levels: **Gaussian Channel Support (~$0.73):** If no candles close below this level, it could act as the first line of defense. However, the current candle appears likely to close beneath it, which would be a bearish signal. **Flag Bottom Support (~$0.70):** The lower boundary of the flag pattern provides a key level for potential price stabilization. **Previous All-Time Low (~$0.62):** If the price breaks further down, this historical support level could come into play. **Bottom of the Gaussian Channel (~$0.39):** The final stronghold before a potential deeper decline.
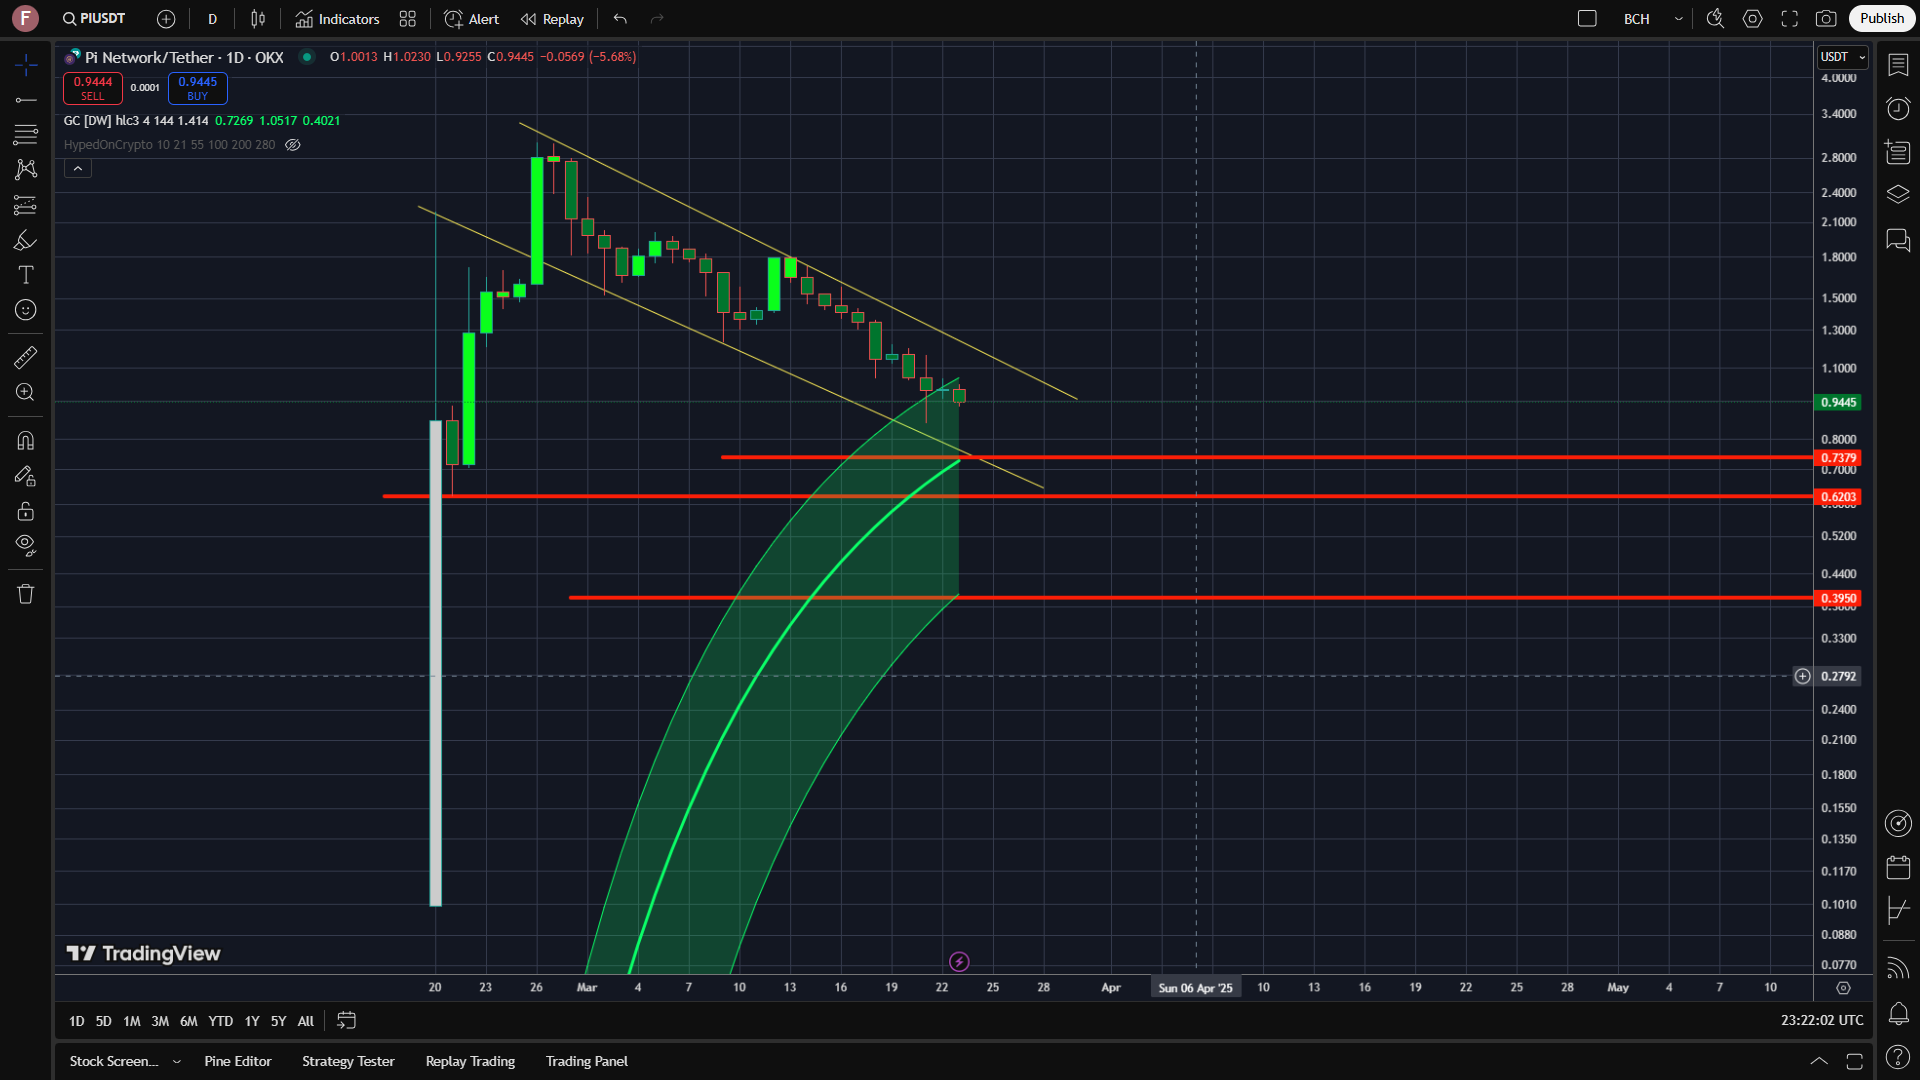
Market dynamics could shift significantly with the upcoming monthly candle close. A bearish March could set the stage for a fresh start in April, potentially from a lower price point. Since daily candles influence trends for about a week to 10 days, there is a possibility of a bullish reversal by early April. If not, support levels will likely be tested progressively. In case of last resort the top of the Gaussian channel in the weekly chart may offer better support around $0.01 but that will have to be analyzed again if we get to those levels.
Support my work by donating me some Pi at: GC3ASMJW7Z2HARLUSULMI3M6V5C3LJP3SNGUEW5MQEKN6PTLPUPUNFBG
https://www.tradingview.com/chart/7rQgNIF6/?symbol=OKX%3APIUSDT
No comments yet