 @francis105d1
more from that month
@francis105d1
more from that month
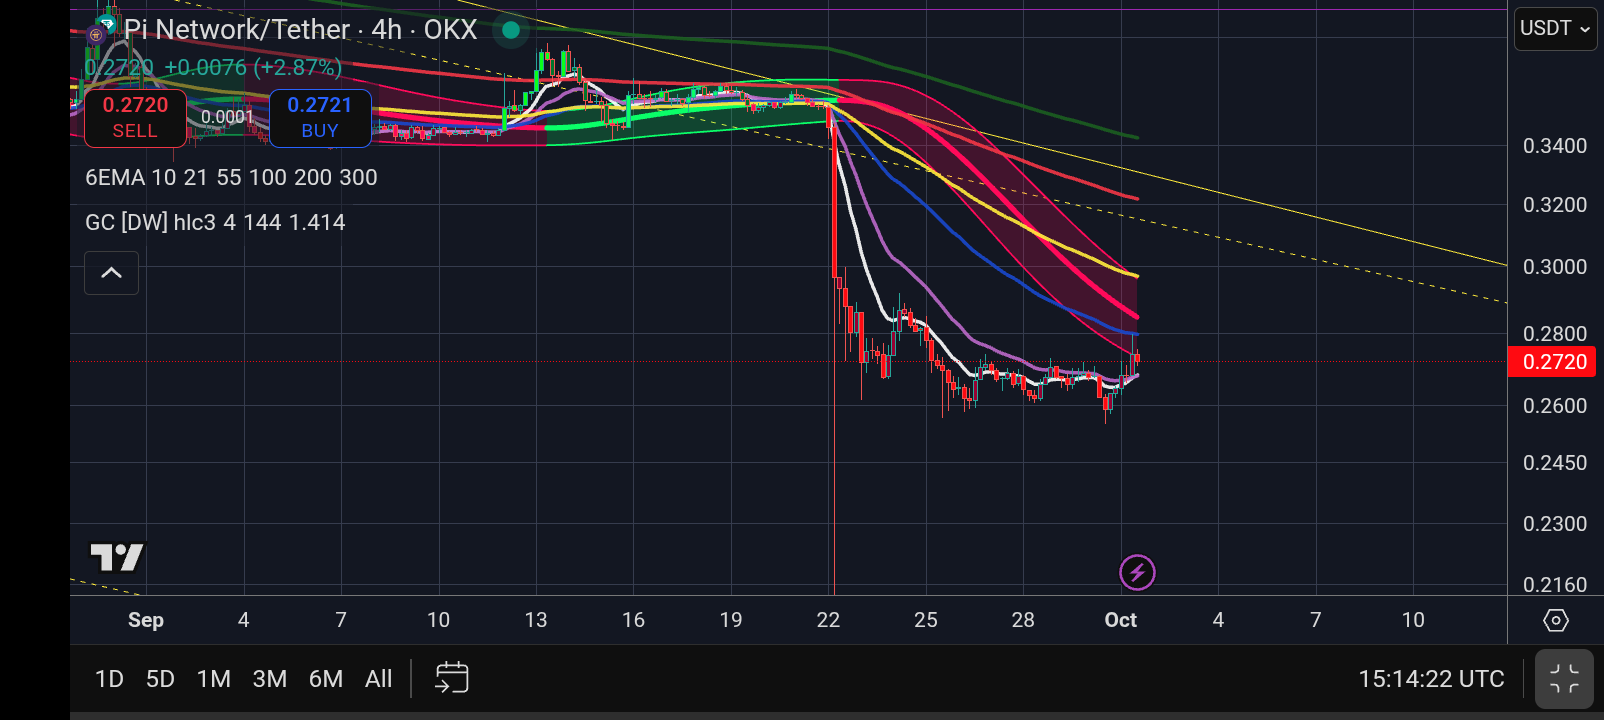
Pi Network Technical Outlook: October and Beyond. In our last analysis, we identified a descending wedge pattern that ultimately broke to the downside, driving Pi’s price toward $0.186 and forming yet another lower low. **4-Hour Chart** On the 4-hour timeframe, resistance sits near $0.28, aligning with the 55 EMA. The upper boundary of the Gaussian Channel, close to the 100 EMA, also reinforces this resistance zone. Unfortunately, the only notable support on this chart remains the recent $0.186 low.
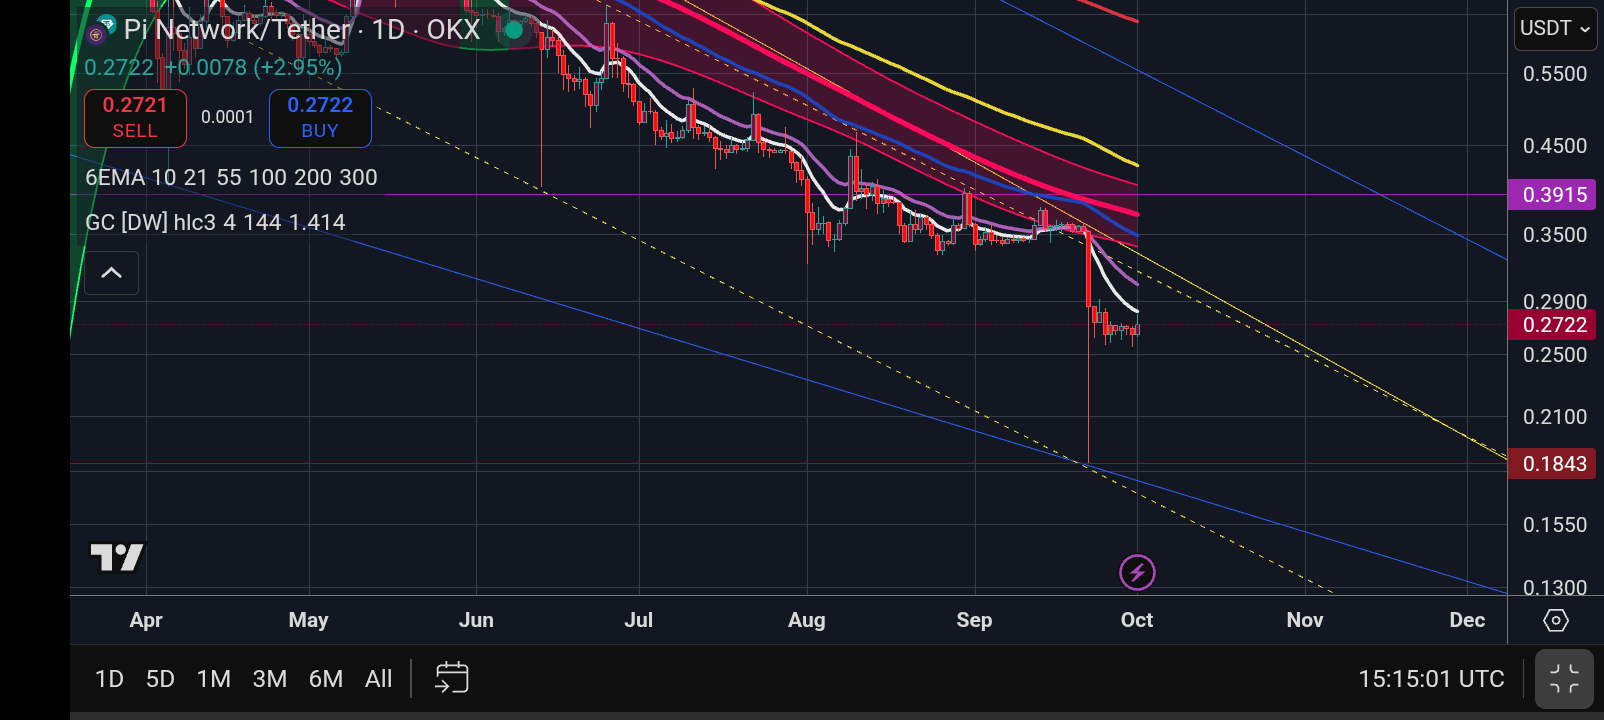
**Daily Chart** The daily timeframe tells a similar story. Support is limited to the $0.186 level, while immediate resistance appears at the 10 EMA and the top of the Gaussian Channel around $0.40. This creates a critical resistance zone between $0.30 (4-hour) and $0.40 (daily). Any move below $0.186 would enter price discovery to the downside.
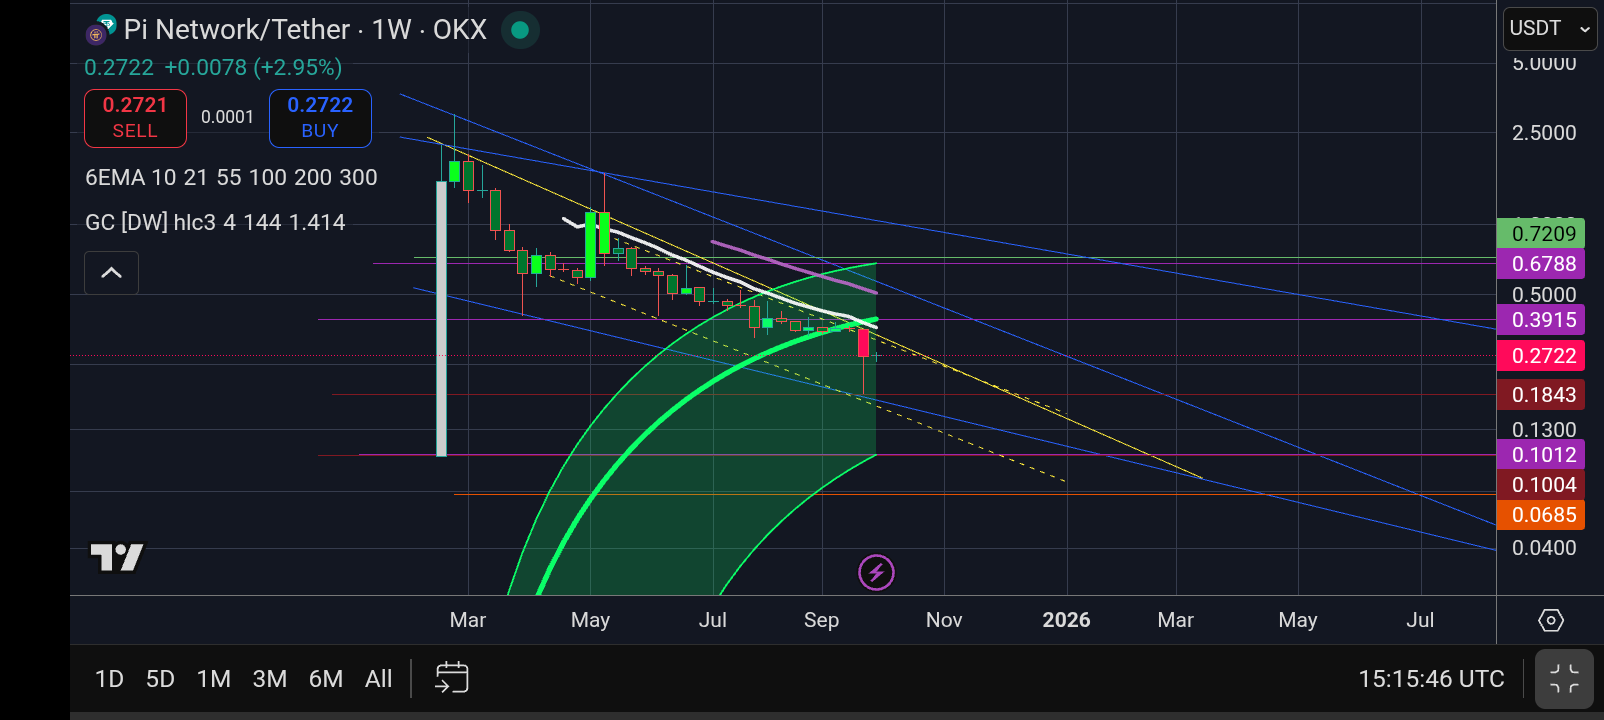
**Weekly Chart** The weekly Gaussian Channel provides stronger context. Here, support emerges near $0.10, which also coincides with Pi’s OKX listing price—making it a key area to watch. Resistance sits at $0.68, where the channel’s upper band converges with the 10 and 21 EMAs. If price were to break below the weekly channel’s lower boundary, the outlook becomes more concerning. Such a breakdown would shift the focus to the **monthly Gaussian Channel** and potentially confirm a long-term bear market. In that scenario, Pi could slide 20%–99% beneath the monthly channel’s $0.06 level, potentially reaching as low as $0.001 or below.
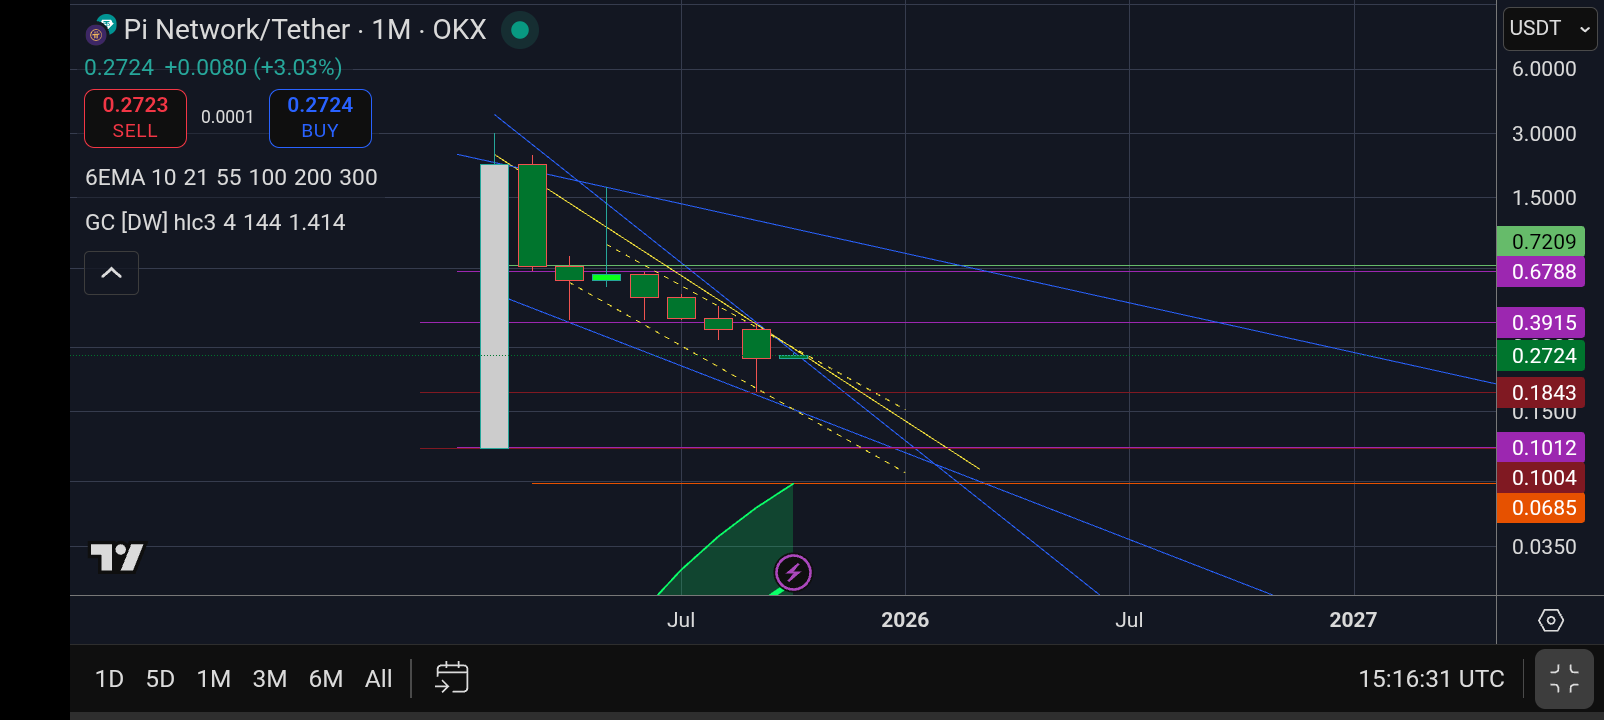
**Monthly Chart** On the monthly timeframe, the Gaussian Channel’s upper boundary suggests support around $0.06. However, this indicator is still developing and will gain more reliability in the coming months.
**Conclusion** **Support Levels:** $0.186 (short-term), $0.10 (weekly & OKX open), $0.06 (monthly GC). **Resistance Levels:** $0.30 (4h), $0.40 (daily), $0.68 (weekly). **Risk:** A break below the weekly Gaussian Channel could open the door to extreme downside, potentially near $0.001. Pi Network remains in a precarious position technically. While immediate upside resistance is clearly defined, downside risk is significant if key supports fail. Traders should watch the $0.186 and $0.10 levels closely in October and beyond.
No comments yet