For the past 4 to 5 days, we have seen a massive selling of our favorite crypto, Bitcoin Cash, which drove the price down from $771 to $405 or a whopping 47% decrease. This is one of the most talked topic in Noise.cash, which triggered my friends and acquaintances there to ask me if they will hold or sell their Bitcoin Cash (BCH).
I have substantial investment in Bitcoin Cash. Hence, it will also benefit me to analyze the price action of Bitcoin Cash. But be conscious that my pecuniary interest could be clouding my own analysis. It could be a wishful thinking. Just so you know.
I also did an analysis of the January correction, please visit it if you have time. Spoiler Alert, Doge Promoter Elon Musk, hastened the recovery of all crypto with TESLA's $1.5 Billion purchase of BTC.
As Technical Analyst, I believe trends have patterns. These patterns will guide us what will be the future directions of BCH. So, let us review the January dip to see if this is a good guide to the future.
Anatomy of the January Correction


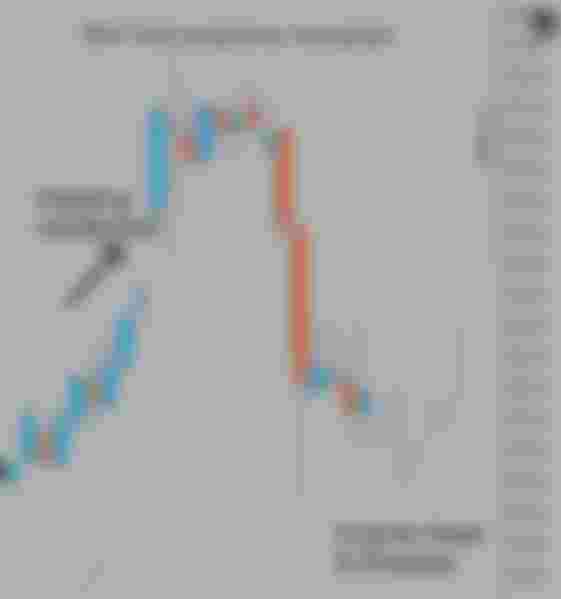
The January correction was preceded by a gapping blue candle stick. This candle stick enabled Bitcoin Cash reached its all time high that year since the 2017 bull run. Based on technical analysis theory, the gap created is always bound to be filled, hence, it is no wonder that the following candlestick filled the void immediately. Also, from a trader's psychology perspective, profit taking is expected whenever an asset reaches its highest price. At the time of selling, the BCH was at overbought territory with an RSI over 70. Take note that whenever BCH reaches over 70 RSI, selling pressures come in. This happened 5 times in current history of BCH. Please also visit this blog where I gave my comprehensive and long-term view of BCH.


Bitcoin cash attempted to recover but there were two more dips before it continued its uptrend. Based on the chart above, you can see that BCH formed an inverse head and shoulder which is a pattern signaling trend reversal to the upside. For more information about head and shoulder pattern, I explained this on my previous blog.
Does history repeat itself?
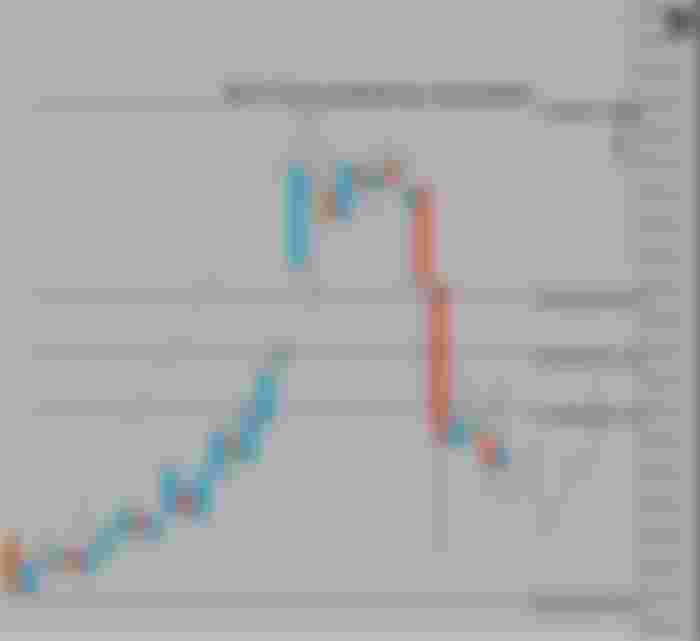
After the breakout of the neckline of the inverse head and shoulder, BCH resumed its rally uptrend. Several weeks later, it created another gapping candle following the BTC rally which was triggered by TESLA's disclosure of $1.5 Billion purchase of BTC last February 9.

Looking at the current chart of BCH, it seems this February correction will have similarity with what happened in January. Another gapping candle caused BCH to attain its second all time high this year. A week after, the void was again filled by red candlesticks just like the last time. As of this writing, it is still forming the right shoulder of the inverse head and shoulder pattern. The first correction lasted for about a month, hence, I expect the same length of time for the correction. If it is shorter, that's good for everyone. If not, it's good for long-term holders like me who are looking to accumulate more of BCH.
Why I am bullish with Bitcoin Cash?
I have discussed in my Noise.cash account the reasons for my bullish outlook.


These are my personal reasons but these claims are something that could be verified out there:
High Volume - compare the 2017 and 2021 volume of transactions, you will see a very sharp difference. There is substantial increase in volume today than 4 years ago. My logic is simple, if BCH reached the all-time-high in 2017 without volume, imagine what it can reach now that it is in demand.
Increasing Projects - The bitcoin.com provides a very thorough list of projects using bitcoin cash. This list definitely has fewer number of projects or it might be even non-existent during the first years of Bitcoin Cash.
The pipeline project that is creating so much buzz in Noise.cash is the Moeing Project which is a sidechain that will enable Bitcoin Cash access DeFi (Decentralized Finance) Projects that are available in Ethereum Network. A sidechain is a separate blockchain that is attached to its parent blockchain using a two-way peg. With this technology, one can move assets to the sidechain and then back to the parent chain. From a layperson, sidechain works like Robin, Batman's sidekick. Batman, who is the Bitcoin Cash, can give or lend to Robin his batmobile, batcave, and other tools and gadgets for crime fighting. After using these assets, Robin can return these back to Batman.
Social Media Presence - Social media platforms are crucial tools in shaping public opinion. They provide avenue to galvanize mass support on a given issue. There are even instances ordinary people banded together to fight back against big and well-funded groups, like the WallStreetBets against Corporate Giants. At the forefront of this mass promotion of BCH in the internet, are Noise.cash and Memo.cash, both are Twitter-like applications that has tipping system using bitcoin cash as rewards.
Merchants adoption - I was amaze that bitcoin.com keeps a tab about merchants from all over the globe who are accepting BCH as mode of payment. Few years ago, there was no one in my country who accepts crypto currency as mode of payment. Now there are several as can be seen in the map below.
I made a random check of these merchants who are accepting BCH as payment and I found that they are quite varied. Majority are small retailers but there are also a couple of medium size companies that are accepting BCH.
To access the map, simply click this link.


Price Levels to watch out for
Using the Fibonacci Retracement tool, I have mapped out the critical areas that traders should be watching carefully.
The 61.80% or $525 level of the Fibonacci Retracement
Incidentally, this level coincides with forming neckline of the inverse head and shoulder. This is a critical area. An uptrend break on this area after would signal a resumption of the bull rally.
The $450 support level - This is where the right and left shoulder might form.
The $400 bottom - This is where the head might form.
The $375 bearish break - A break downtrend at this level signals change in trend towards bearish territory because it creates a lower low.

Disclaimer
Trade at your own risk. Do not take this blog as investment advice. I am not your financial advisor and I do not know your circumstances and profile as investor. Although, I always make sure that the data I use is accurate and my analysis is based on my technical knowledge, I make no representation that my prediction will happen. Information posted here should be treated only for educational purposes.
Thank you very much