

It is not easy to predict how the prices will move in the crypto money market. The fact that the prices in the market are quite variable allows users to follow different strategies. Many users in the crypto money markets benefit from technical analysis in strategy determination. For this reason, we use some helpful methods while analyzing. Thus, I can predict the future price movements of a cryptocurrency. In this way, I can make predictions based on information about how the price movements will increase or not.
When they heard about the concept of technical analysis, there may have been those who were intimidated at first. In this article, I will focus on and explain in a simple way the technical analysis concepts on cryptocurrencies that seem confusing to those who do not know.
Technical Analysis Definition
Technical analysis is carried out using real market data of the coins in the crypto money market. Technical analysis is an analysis method that basically uses mathematics to predict future price movements in the light of past movements. There are multiple technical analysis methods available. In this article, I will talk about the most known technical analysis methods.
Candlestick Charts
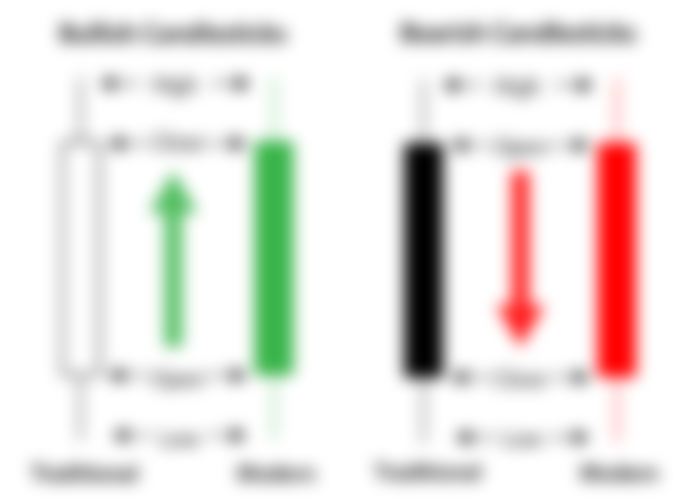

It is one of the most used charts by investors who use technical analysis in the crypto money market. When we look at the history of candlestick charts, we see that it was developed by the Japanese in the 17th century by using it in the rice trade. Today, they are used to analyze the changes in prices. Of course, we need some data while doing this. To create a candlestick chart, I need the opening, high, low and closing levels that occur in the desired time frame.
Candles give detailed information about the market according to the desired time, this time can be daily, weekly, monthly or yearly. Often, a positive move is shown in green in the candle, while a negative move is shown in red. Candlestick charts show the size of price movements in different colors. While reviewing candlestick charts, the long green candles formed are indicative of an uptrend. This means that the time between the opening and closing of the market price is usually a rise and there are lots of cryptocurrency buying transactions. Long red candles show us a downward trend. What is meant to be explained here shows that the prices remain at a lower level at the closing compared to the opening. From this situation, we can understand that investors are selling their crypto assets. If we want to make a general sense, the long candles of the formed candles indicate that the price movements are aggressive, on the contrary, the short candle bodies show the slight price changes.
Trend Lines
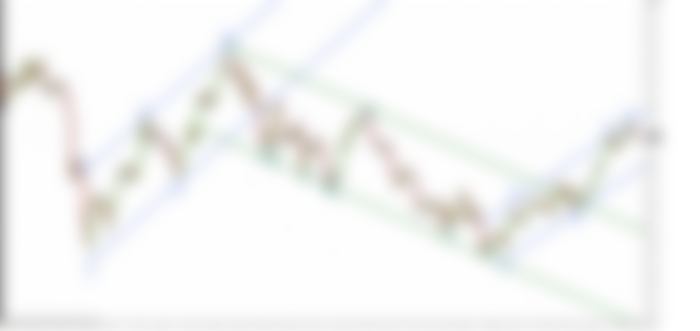

One of the most important elements of technical analysis that cryptocurrency investors should know and learn is trend lines. The trend lines show the direction of movement of the cryptocurrency under study. Of course, some analysis is needed to do this. The high volatility makes the fluctuations in the trend line meaningful.
The upward or downward movement of the trend lines shows us the price increases or decreases. On the contrary, it shows us that the fluctuation in prices is at a lower level with the formation of horizontal lines.
The interpretation of trend lines is very important for those who have knowledge of technical analysis. By predicting the direction of the trend line, it can identify an up or down trend and direct its investments accordingly.
Support and Resistance

Another concept that investors who will make technical analysis should understand are support and resistance levels. With support and resistance, you can predict investor movements and determine the strategy you will create while making your investments. If you want to perform a "stop-limit" transaction while performing your trading transactions, it is a technical analysis method that you should learn.
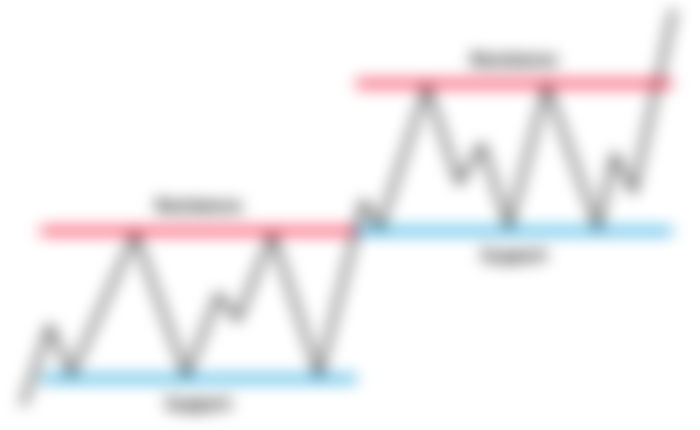
The support level shows us the willingness of the people who will invest in crypto to buy at this point. In cases that occur at the support level, we can understand that the value of the crypto currency is low and the price will increase with purchases. We can say that the resistance level is the opposite of the support level. In this case, there is a high supply but low demand.
Investors at this point will feel that the cryptocurrency is over-priced. They anticipate a decrease from this point on. After the price of the cryptocurrency reaches this point, a decrease is expected and there is no demand for excessive supply increase. Therefore, prices start to fall. Sometimes there are breaks in support and resistance levels. If the level of resistance at the beginning of the analysis is in support of the chart, the trend will get stronger. Ultimately, technical analysis requires looking at multiple shapes to identify trends.
Choosing Time Frames
When dealing with technical analysis, you have the option to choose your own time zone. The choice you make should be in line with your commercial strategy. If you are a short term investor, you should choose a short time frame. This will allow you not to miss any opportunities that may arise. If you have a long-term investment strategy, you can determine a chart time over days, weeks or months. This will allow you to look at a larger time frame.
Indicator
We call technical analysis indicators as indicators. They are mathematical results that provide data about the direction of the price or the trend for technical analysis users. Indicators are technical analysis tools that guide investors about changes in the cryptocurrency market. To put it simply, it examines the old movements of prices and their current situation.
Oscillators
They are indicators that act within certain limits. It gives us over-selling and overbought levels. A cryptocurrency, which is in an upward trend, can give us the best sales area, as well as give us data in the opposite case. In some cases, it can give trend independent results. Often times, they may not be enough on their own.
Moving Averages
Moving averages are an important technical analysis element that investors use when managing their risk management. Moving averages, one of the first indicators that come to mind, are one of the biggest helpers for us when doing technical analysis.
When price movements are examined on the line chart, they appear as zigzags. Moving averages are "Lagging" indicators of lagging. Thanks to this delay, it will keep us away from potentially erroneous signals. It softens the appearance of sudden increases or decreases on the chart as it is averaged.
Moving averages, which provide analysis in every market condition, help us to determine our strategies. There are types suitable for use in an emerging market or horizontal market. The primary purpose of moving averages is to determine trends. While being above the moving average indicates a rising trend, when we are below, there is a decreasing trend.
Bollinger Bands
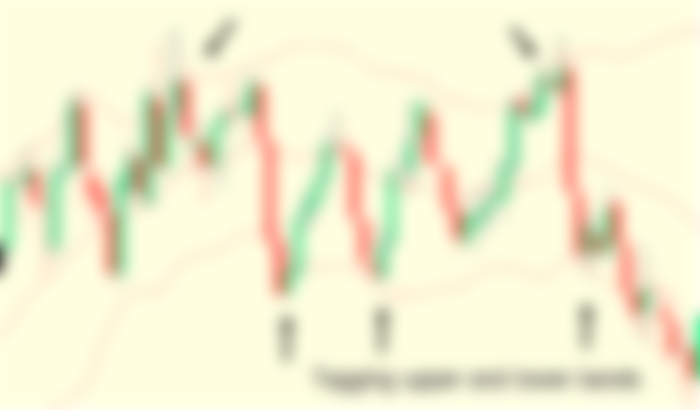
Bollinger bands are obtained by placing them above and below the moving averages. It is an analysis tool that is shaped according to the direction of the market. The Bollinger Band contracts and takes the appearance of a pipe when price movements are uncertain. If the market reveals its direction, the channel will expand and we can predict that the market is not indecisive. Thanks to the Bollinger bands, it shows us whether the prices are high or low.
Relative Strength Index (RSI)

In its simplest form, it gives us overbought or sell signals. It produces values between 0 and 100 for us. These values mean to buy when the RSI is below 30 and sell when it is above 70. It can be useful for us to determine whether there will be a withdrawal in the future.
The Importance of Technical Analysis
The technical analysis tools I mentioned here often get more meaningful and consistent results when used together. If you are investing and want these investments to make sense, you should learn technical analysis and put these learning into practice.
The concept of technical analysis works on the principle of "ceteris paribus" (when all variables are constant) in economics. It gives results independent of the effects of the statements and regulations on the crypto money market. For this reason, it is beneficial to make my investments by following the current news without ignoring this situation.
As a result, as a result of my technical analysis, I get information about the movements of a cryptocurrency in its past and it becomes easier for me to predict the movements it can make in the future.
If you liked my article, do not forget to like and comment, I wish you all a lot of profits.
All the indicators listed above are really good, I've used all of them in the beginning when I was learning how to trade. but now I use a combination of support resistance levels for entry points. waddah attar explosion indicator for volume , aroon indicator for trend confirmation and a Exponential moving average to show me when to exit the trade. and the Heiken-Ashi candlesticks just to quiet things down when I'm in a trade.