 @Today
more from that month
@Today
more from that month
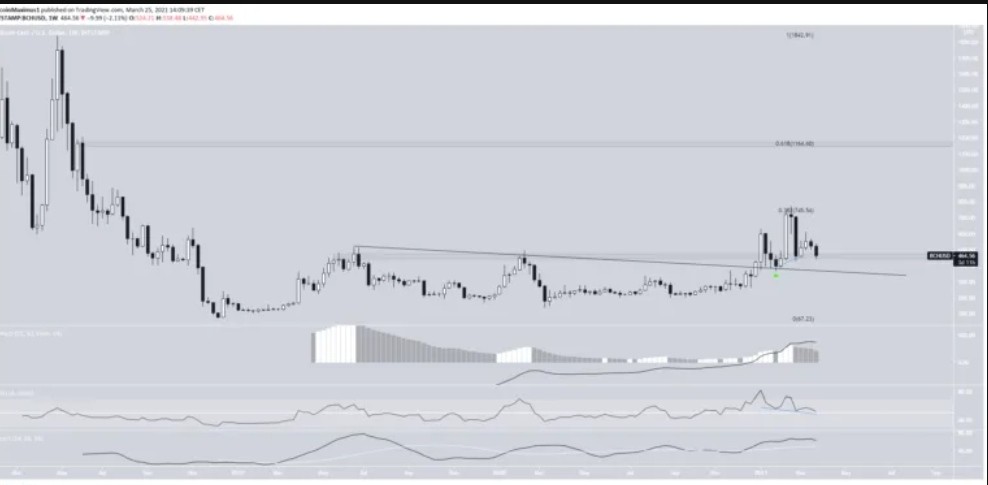
Bitcoin Cash (BCH) At the beginning of January, BCH broke out from a long-term descending resistance line. After validating the line as support, BCH moved upwards, reaching a high of $773. While BCH dropped afterward, it is still trading above the $465 level, which is now supposed to act as support. Also, the RSI has generated hidden bearish divergence. While both the MACD & Stochastic oscillator are decreasing, they are both positive. These are signs that the trend is likely still bullish. If BCH manages to move upwards, the next long-term resistance levels are $745 and $1165.
No comments yet