 @Tintuccrypto
more from that month
@Tintuccrypto
more from that month
🔥 Bitcoin Daily Analysis – September 10th, 2025: The Calm Before the Next Big Storm? 🔥 Bitcoin (BTC) is sitting at a critical juncture today. The price hovers around **$111,400**, consolidating between major support and resistance zones. From the daily (D1), 4-hour (H4), and 1-hour (H1) charts, we can see that BTC is compressing into a tight range, and when Bitcoin coils like this, it rarely stays quiet for long. Let’s break it down step by step for a full view of today’s market. 📌 Daily Chart (D1) – The Macro Battlefield
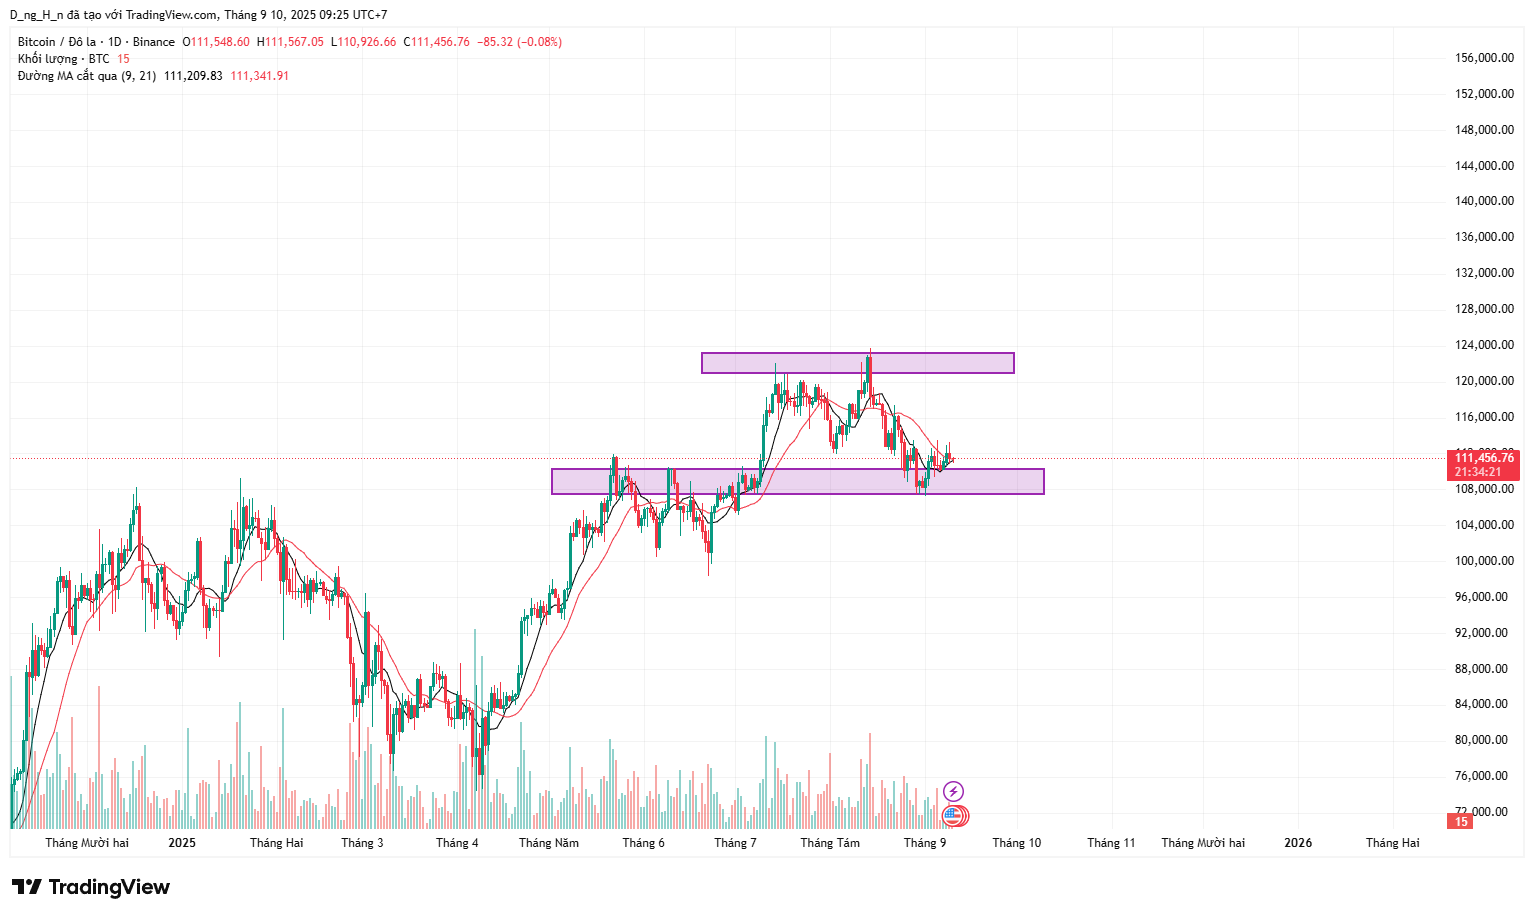
On the daily timeframe, BTC has been trading in a wide horizontal channel. The **support zone is between $108,000 – $109,000**, and the **resistance zone sits near $122,000 – $124,000**. Recently, BTC bounced from the bottom of this support range, showing strong buyer defense at $108K. However, the rallies have been capped around $122K, showing that the bears are actively protecting that level. The moving averages (MA 9 and 21) are flat, suggesting a sideways consolidation rather than a strong trending market. 👉 **Conclusion D1:** Bitcoin is in accumulation mode. The more time it spends above $108K, the higher the probability of a breakout to the upside. But a clean break below $108K could trigger panic selling toward $100K. 📌 4-Hour Chart (H4) – The Compression Zone
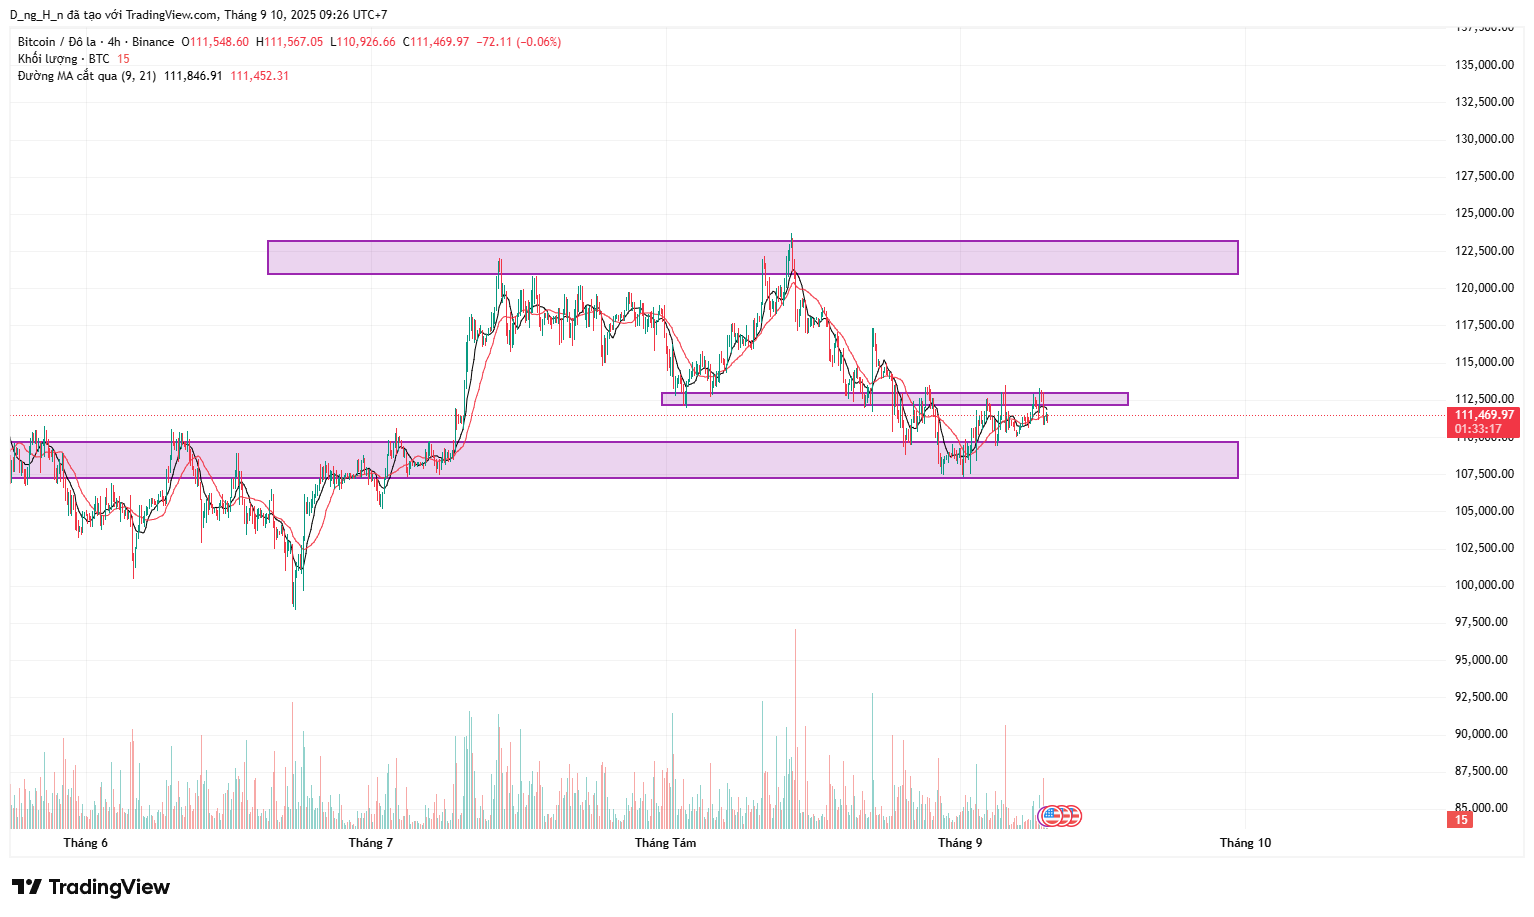
Zooming into the H4 chart, the picture gets clearer. BTC is forming a **range between $110,500 – $113,500**. Buyers are stepping in at $110.5K with multiple wicks rejecting further downside. Sellers, however, are keeping the lid on around $113.5K – every attempt to push higher has been met with rejection. This creates a **compression triangle**, and such setups usually end with a breakout move. 👉 **Conclusion H4:** BTC is preparing for a decisive move. A breakout above $113.5K could quickly push price toward $118K, while a breakdown below $110.5K risks a drop to $108K. 📌 1-Hour Chart (H1) – Short-Term Trading Setups
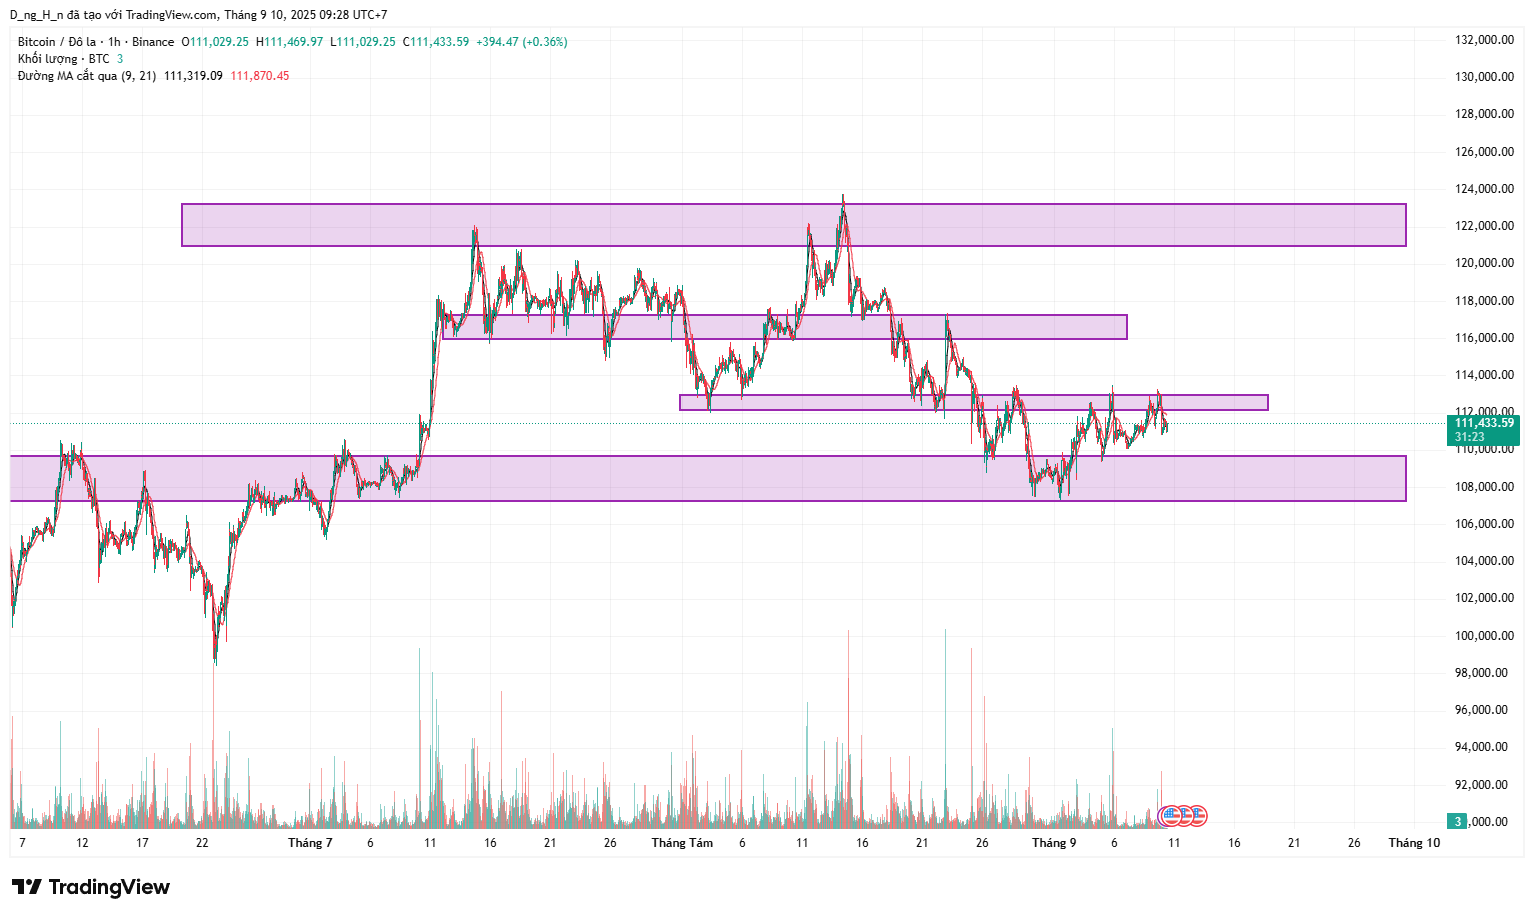
On the H1, BTC looks choppy but still respects its key zones. Short-term support: **$110,800 – $111,000**. Short-term resistance: **$112,800 – $113,500**. Volume is decreasing, which often signals that a bigger move is coming. 👉 **Intraday Idea:** **Long entry:** $111,000 – $111,300 **Short entry:** If BTC fails a 🎯 The **main** look**sideways with bullish potent**, as lon I 🚀 Key Level **Support:** $111,000 – $1 **Resistance:** $113,500 → If **Trend** Neutral to Bul ✍️ Bitcoin is in a “calm before the storm” setup. Traders should prepare for volatility as BTC compresses in a tight range. Whether we see a bullish breakout or a bearish flush depends entirely on how price reacts around **$110.5K and $113.5K**. ⚡️For today 👉 **Entry ideas:** Long: $111K – $111.3K, TP $113.5K / $118K. Short: Rejection at $113.5K, TP $111K / $108K.
No comments yet