 @Stocker
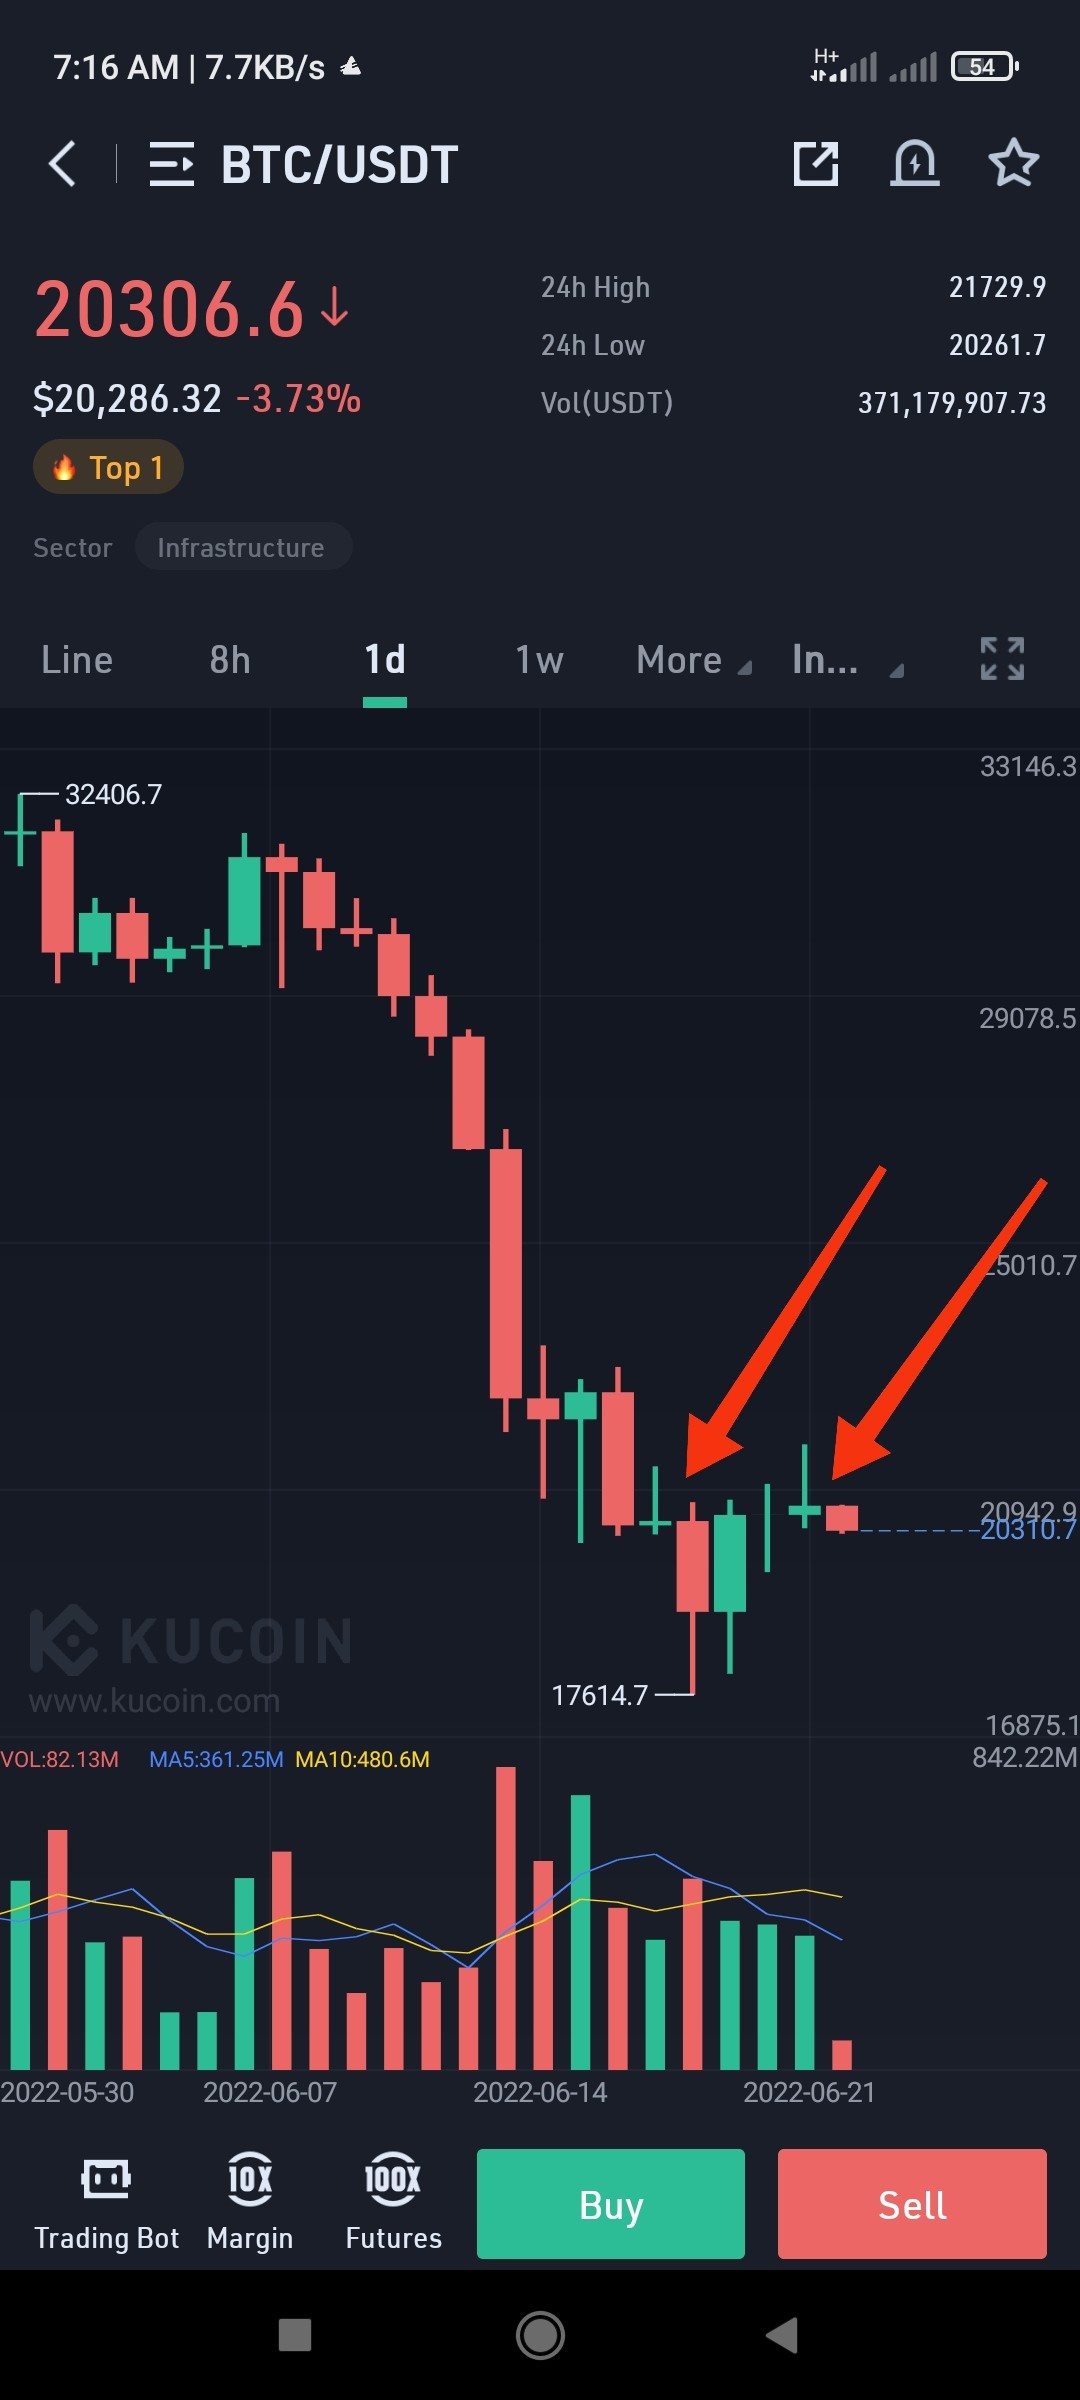
Doji candle stick formation always indicates a market reversal especially during a market trend. If you are conversant with candle patterns in online currency charts, you will understand what a Doji candle is. If you look at the BTC chart, we had a first Doji at the $20k region which later resulted in market dip to $17k at the weekend. Now, we are having a similar Doji candle formation at almost same spot of $20k region and the market is already reacting to it. We are still in Bear market, so any reversal now may be a genuine one. #Cryptotrading #Cryptocurrency
4 comments
I interpret it as indecisive market so far. Testing 17k or 24k would not surprise any of us ^^
The thing about trading is that nothing is given. Nothing is 100%. That doji candle closed above the previous one you were referencing and is also a positive doji, so could also mean there might be a support. But then it's a bearish trend so might resume another round of falls. I would switch to a lower time frame to get a clearer direction. Still, na 50/50
That's the nice move, we can't confirm now just seeing in one time frame.
Always, no my friend, we need confirmation on the next candle. Doji may also form in the middle of a trend.