 @Oneray
more from that month
@Oneray
more from that month
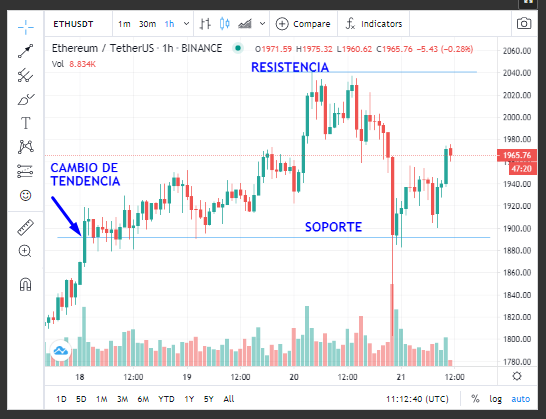
Learning to read chart patterns and charts is nothing to write home about. It only takes training the eye to know what has happened. Let's go with the ETH: In the chart, we can see a resistance that became support due to the change in polarity at $ 1982 and continues its upward path until it finds itself in an area where sellers did not allow the price to continue rising and forming a resistance zone at $ 2042. Now between these two prices, consolidation can occur and stay in this zone for a long time until the bullish momentum drives it to scale new heights. What to do then? When the price reaches $ 2042 again we will see who puts more pressure to take advantage of the moment, that is, and there is more selling force, we can use the correction as profit-taking, selling to buy again at a lower point, or for the Otherwise, keep the coin and see how far you can go. You can see the image and detail what I just explained. #Cryptocurrency
No comments yet