 @Laurenceuuu
more from that month
@Laurenceuuu
more from that month
Beginner's Guide: How to use Bollinger Band? On the previous article, we discussed the **support and resistance** and now, we will talk about one indicator that will be helpful to confirm the bounce back of the price level of the coin. This indicator is related to support and resistance because it has almost the same objective and use. https://read.cash/@Laurenceuuu/explaining-the-basics-of-support-and-resistance-efe93da9 If you haven't read the simple guide in support and resistance, click this text. https://read.cash/@Laurenceuuu/explaining-the-basics-of-support-and-resistance-efe93da9 WHAT IS BOLLINGER BAND?
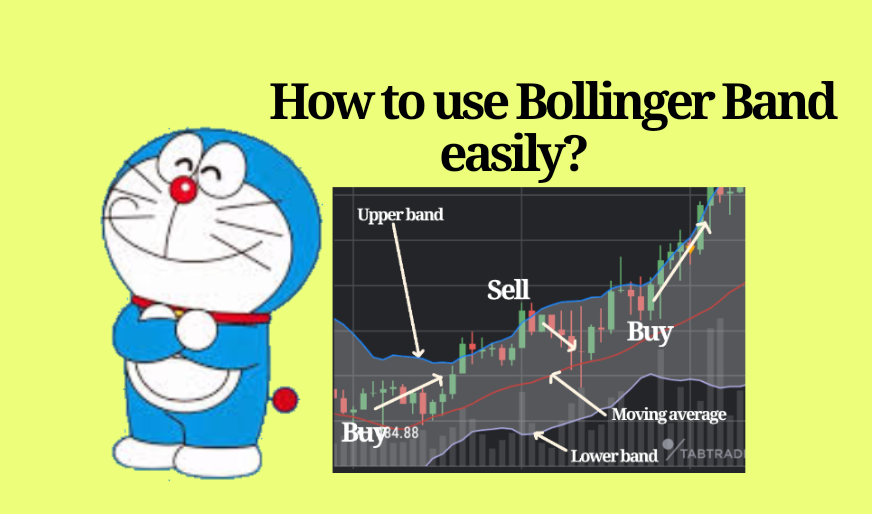
Let us borrow the definition of this indicator from **Investopedia**, *“it is a technical analysis tool defined by a set of trendlines plotted two standard deviations (positively and negatively) away from a* ***Simple Moving Average (SMA)*** *of security’s price, but which can be adjusted to user preferences.”* https://www.investopedia.com/terms/b/bollingerbands.asp It is a technical analysis tool developed by **John Bollinger** to determine if the price is **oversold** or **overbought**. It has three lines that we need to be familiar, let us call it as **“Anatomy of Bollinger band”**. The three lines are called **1. SMA or Simple Moving Average, 2. Upper band, 3. Lower band.**
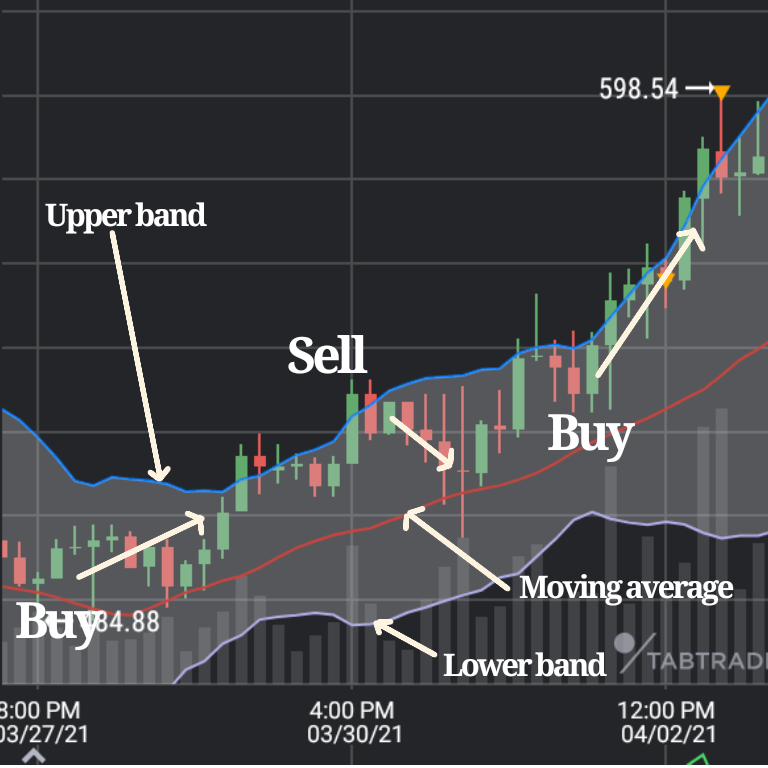
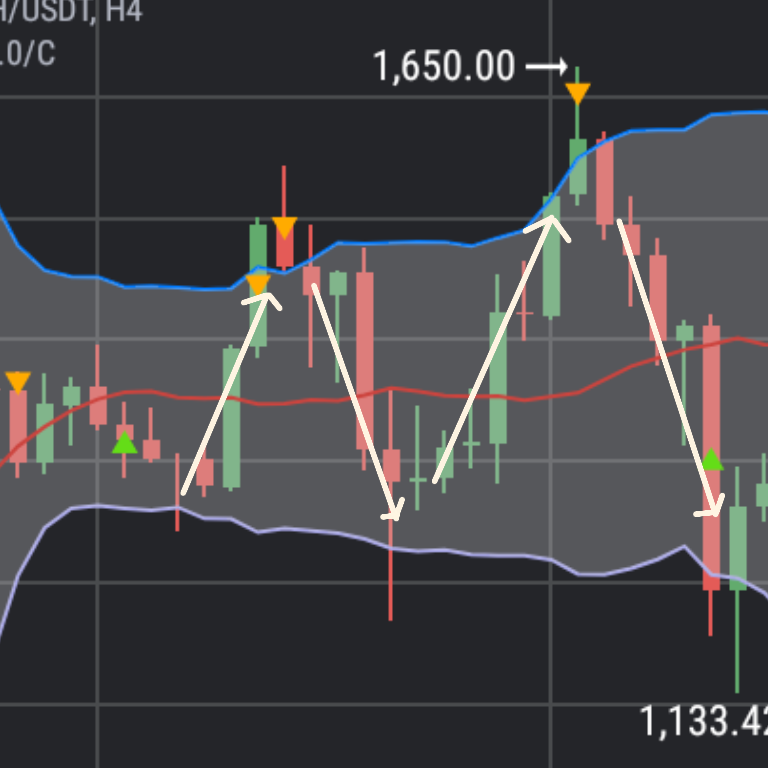
The default settings of **upper and lower bands typically 2 standard deviations (+ and -) from a 20-day simple moving average** but remember that you can change it depends on your preferences. Honestly, the Bollinger band has a formula which is: BOLU=MA (TP, n) + m * standard deviation [TP,n] BOLD=MA (TP, n) - m * standard deviation [TP,n] **Where:** BOLU= Upper Bollinger Band BOLD=Lower Bollinger Band MA=Moving Average TP=(typical price) = (High + Low + Close) / 3 n= Number of days in smoothing period (typically 20) m= number of standard deviation (typically 2) standard deviation [TP, n] =Standard deviation over last n periods of TP. Since we can simply use Bollinger band automatically in the exchanger that we are using, I am not solving it manually. To understand this indicator with an ease, let me discuss how Bollinger works in trading by giving an example. ***Disclaimer:*** *Feel free to correct the errors, I'm a noob so expect some errors. Please give your constructive feedback. Thank you!* **Example 1. Upper band to lower band** In this example, the price level of the coin was bounced on the **upper band** and **lower band** repeatedly. Let us relate it in the support and resistance, the **upper band is like the resistance while the lower band is the support.** When the price touched the upper band, there is a possibility that it will go down again and touch the lower band. In some instances, the price is breaking the lower and upper band creating another level and support or resistance. https://read.cash/@Laurenceuuu/explaining-the-basics-of-support-and-resistance-efe93da9
**Example 2. Upper band to Simple Moving Average (SMA)** As what I have mentioned on the introduction, there are three different parts of Bollinger band, the upper, lower, and simple moving average. In the second example, the Simple Moving Average is involved. As what you can see, the price of the coin was bounced on the Moving Average instead of the lower band. In this case, we will consider the upper band as the resistance and the moving average as the support. If the price breaks the moving average, it is possible that the lower band will be the next support.
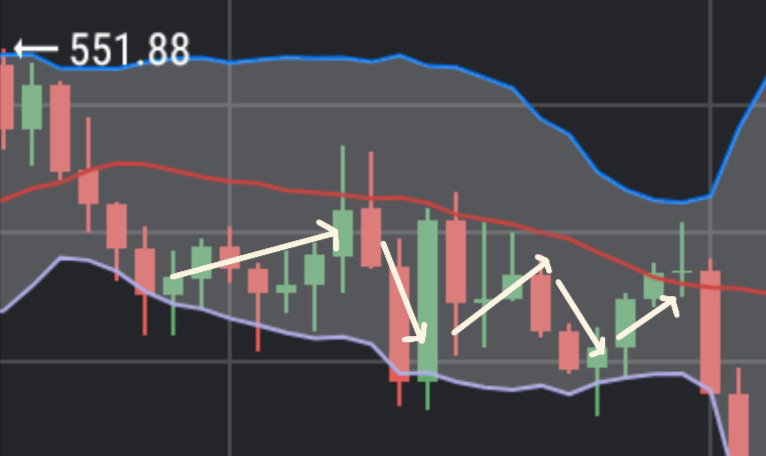
**Example 3. Lower band to Simple Moving Average** In the last example, the lower band and the simple moving average is involved. As what you can see on the photo, the price bounced on the lower band and bounced again on the moving average. In this case, we can consider the lower band as the support and the moving average as the resistance.
SQUEEZE It is one of the concepts in Bollinger band. When the bands are coming close together nearer the moving average, it is called squeeze. If there is a squeeze in the Bollinger band, traders considered it as a period of low volatility and can be a potential sign of future increased volatility. On the other hand, if the bands are becoming wider, it can be the signal of decrease in volatility. ****However, it is not considered as trading signals.**** Conclusion This content is based on my research and experience. You can always do your own research to give emphasis on every terminology that I used. Also, it is better to trade at your own risk and use different indicators to confirm and predict the price movement. This indicator is just a guide and possibly not accurate in some instances. Source: https://www.investopedia.com/terms/b/bollingerbands.asp **Published:** May 19, 2021







5 comments
Galing nmn nito hahaha mga trading indicators na tinitira 😁
Hahaha kunwari marunong😆
Tell me about by which formula i can track out the resistance and support zone of every coin? Ofcourse i can not Just depend on indicators as well on my chart set up
It is included on the article: BOLU=MA (TP, n) + m x standard deviation [TP,n] BOLD=MA (TP, n) - m x standard deviation [TP,n]
And the success possibility?