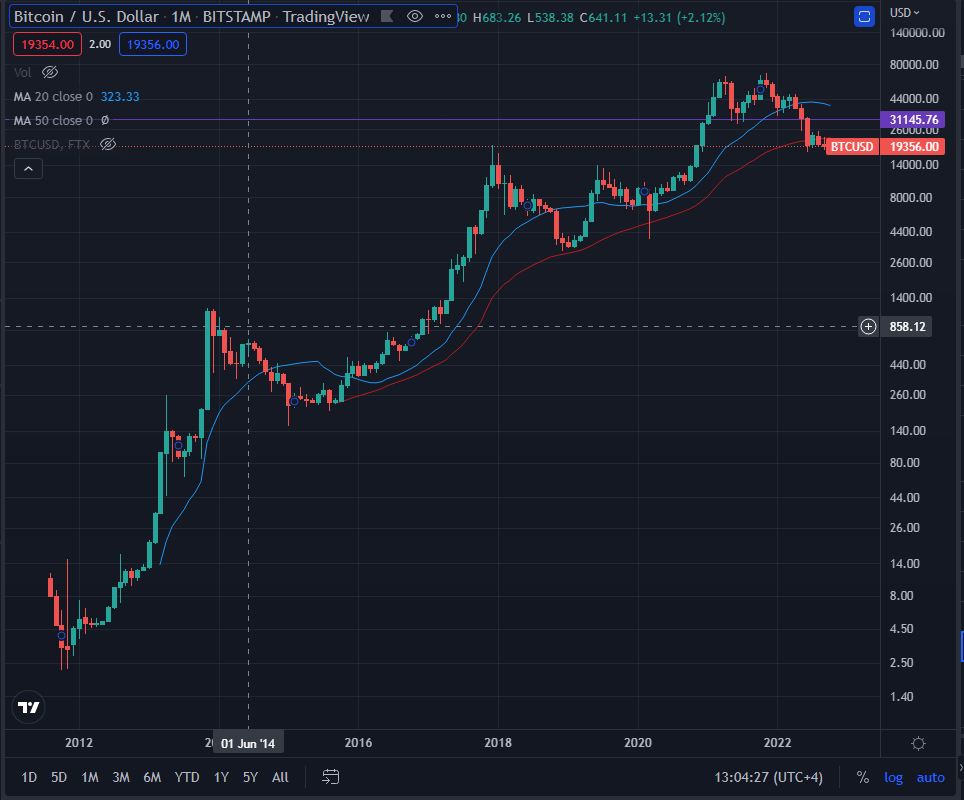
Looking at (almost) entire history history if Bitcoin price chart, it's hard to ignore how it seems to be weakening with every cycle. Especially considering the last 12 years were part of the 'prosperity' cycle of the larger global economy. So I think time here will be the strongest factor to determine its future. The current strong 18.6k support can easily break not because it'd be tested many times, but because the "this may not moon ever again" thoughts may start to creep in. Then the longest holders may start changing their minds. Could also be the total opposite. The instability around the world could lead the actual value of decentrlized finance to be noticed. Is that good for the bull run? Not necessarily IMO, but it's definitely good for the actual vision and purpose of crypto.
4 comments
That is what a logarithmic scale should look like.
Yeah it makes sense only with log scale
Bitcoin =/= Crypto. I'd be interested in seeing the chart of crypto as a whole. BTC dominance was never going to be forever.
Absolutely true. I really thought about capturing total mcap/usd chart but was too lazy because this chart was ready and snapshot already was taken hehe