 @IgorBelykh
more from that month
@IgorBelykh
more from that month
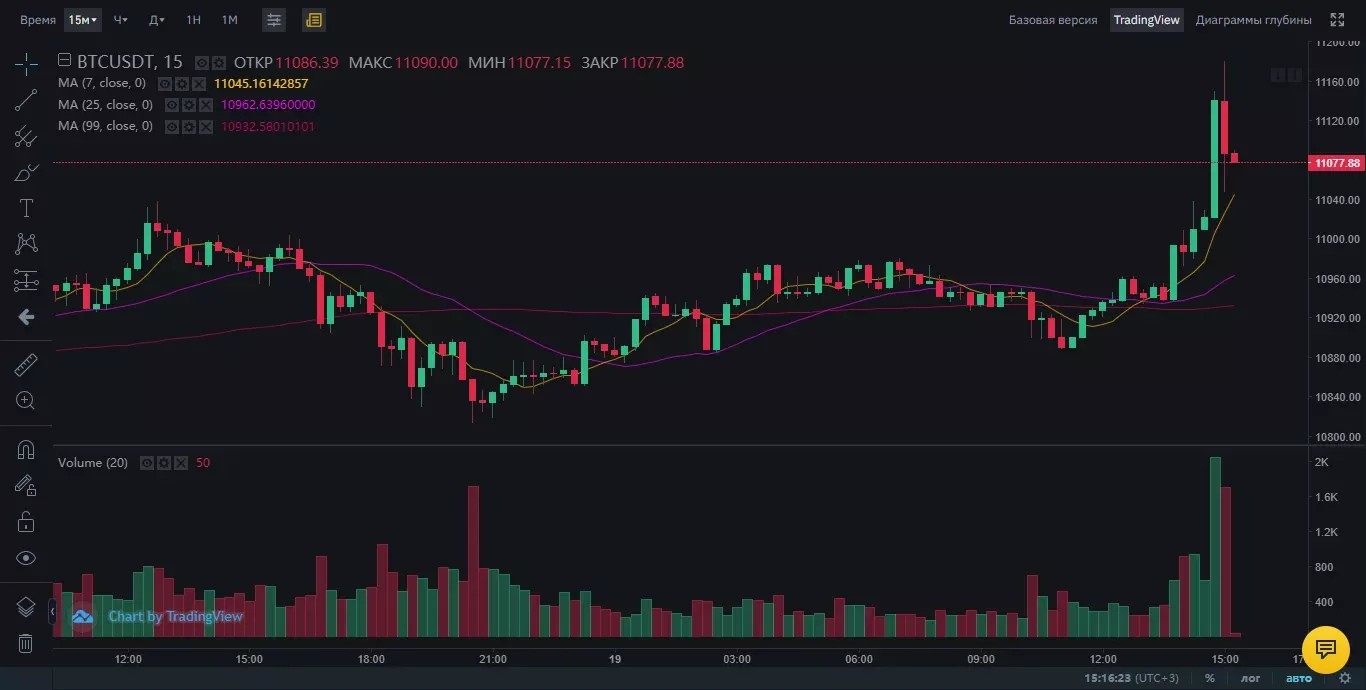
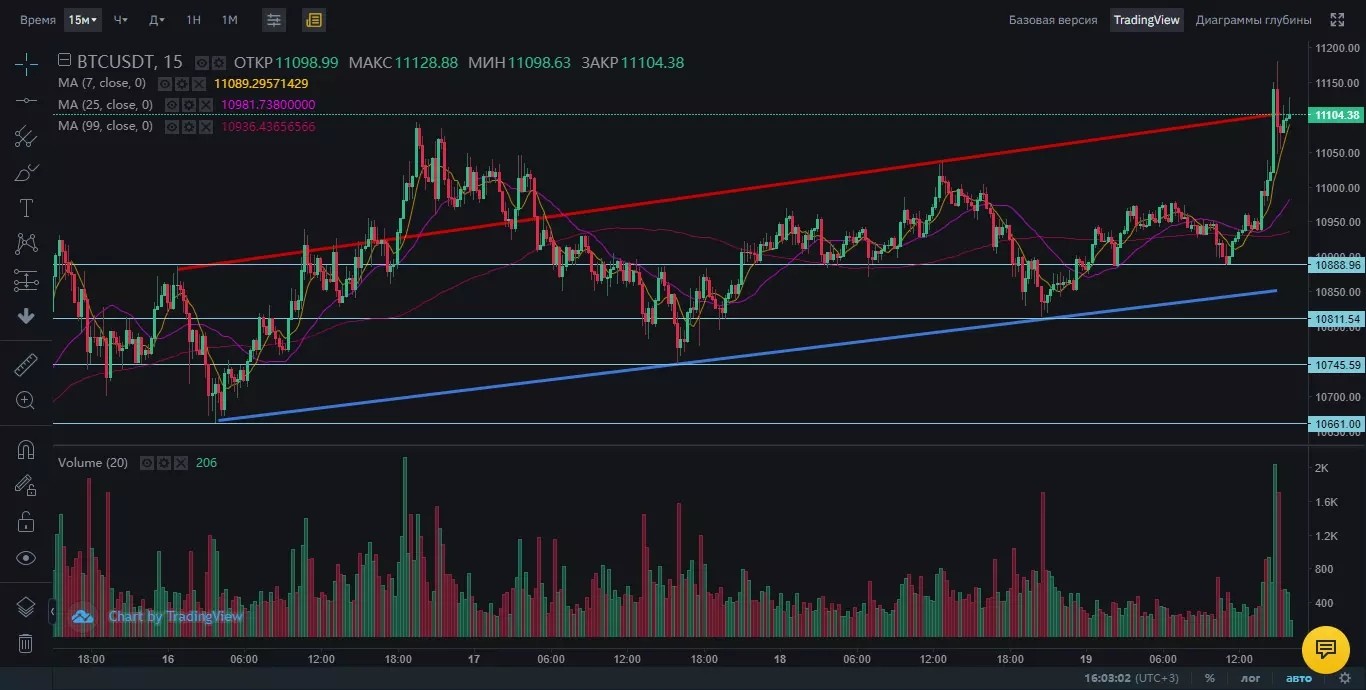
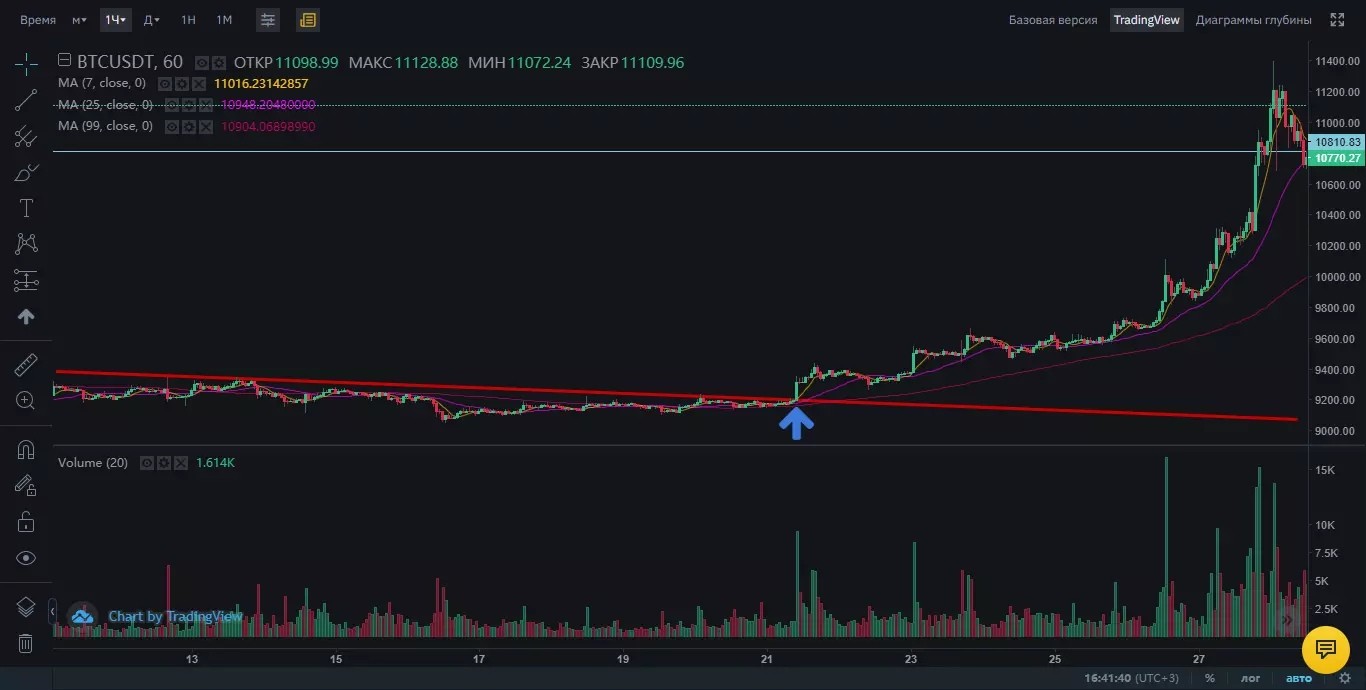
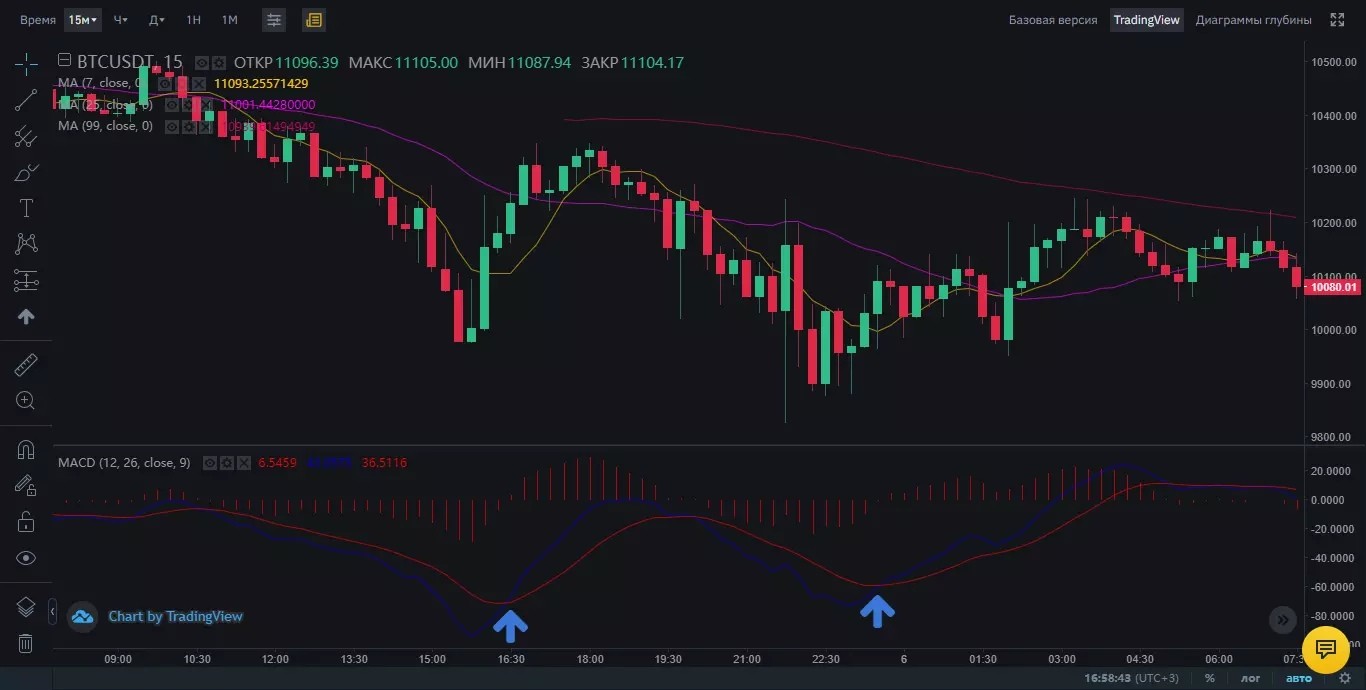
I want to make you a crypto expert. I will teach 4 important trading skills. If you know cryptocurrency, great, if you don't know, I'll teach you. Part 1 •SCALPING (See image 1) Not the easiest strategy for beginner crypto traders, but with proper risk management, it can bring good results. The essence of scalping is to make many transactions during the day to get a small profit up to a few percent. However, cryptocurrencies are highly volatile assets, and their price can change by 10% - 50% or more within one day. But this carries increased risks for traders, especially beginners. How to trade It is important for a trader to determine at least two key parameters: support/resistance levels and trend direction. With the help of support and resistance levels, a trader can determine when it is best to open / close positions. When the price rebounds from the lower border, this is a buy signal, and a rebound from the upper border is a sell signal. Part 2 : •TREND TRADING (See image 2 ) Trends are local and global. Global trends are suitable for medium and long term trading. How to understand that the trend is up? During an uptrend, the price moves like a ladder in a narrow channel and may slightly go beyond it. Moreover, as a rule, each local minimum is higher than the previous one. The same is true for local maxima. How to trade? So, when you have determined that the trend is up, it is necessary to highlight the key support and resistance levels - we will build on them. Accordingly, the support zone is suitable for opening long positions, and the resistance zone is suitable for closing. As you can see in the picture below, the price of the cryptocurrency fluctuates in a narrow corridor. And the local minima and maxima are higher than the previous ones (in the screenshot, the minima are marked with white horizontal lines). In a downtrend, the signal to start trading will be a breakdown of the resistance level. However, sometimes the breakdown may turn out to be false. If the price quickly rolled back after the breakout and returned to its original position, this may indicate a false breakout. At this time, it is better to wait until the trend is clearly manifested. Part 3 •Analyzing the RESISTANCE LEVEL BREAKOUT strategy (See image 3) I note that it is used when a new trend has not yet formed, but a key level breakout may indicate its change.During a certain period of time, the price can bounce from support and resistance levels for a long time. Sooner or later, the forces of the market are outweighed in the other direction: the price cannot move in only one direction. When the rate rises significantly, buyers weaken and bears actively join the game. The reverse is also true. How to determine that the trend can change? When approaching this moment, the price amplitude begins to decrease, that is, the price is in a sideways movement or in a flat. A breakdown of the resistance level may indicate the beginning of an uptrend. And before that, sellers “push” the price closer to the resistance level. One of the characteristic signs of a trend change can be observed when the resistance level practically does not change, and the support level approaches it, closing the chart in the form of a kind of wedge. At a certain moment, the resistance level is broken and the price starts to rise, indicating the emergence of a new uptrend. At the same time, it is important that the price does not immediately roll back to the previous level - this phenomenon is called a false breakout. How to trade? There is no need to rush and open a position immediately after the price breaks above the resistance level. It is necessary that the following condition be met: the new formed support level should not be lower than the previous resistance level. In this case, you can open long and then trade with the trend. Part 4 : MACD Strategy (See image 4) MACD (Moving Average Convergence/Divergence) is one of the most popular and simple trading indicators.It is the simplicity of its use that has caused such popularity of the indicator. How to trade? The signal to buy cryptocurrency will be the intersection of the fast and slow MA lines below the zero MACD level. At the same time, the fast moving average should cross the slow MA from the bottom up - this is what signals the price reversal to growth. A signal to sell, respectively, will be the intersection of the slow MA from top to bottom. At the same time, it is not necessary that this intersection be above the zero level of the MACD I hope after reading this you will learn something new Regards : CryptoGuru
2 comments
Much needed post. Please also teach them about risk management, very key
Sure. Every Investor must understand what is Risk management and its role