 @HuzaifaFarhad
more from that month
@HuzaifaFarhad
more from that month
🚀 Bitcoin Wave Count Update: Bulls Holding Key Levels for Potential Rally Bitcoin is still in the spotlight as we track the unfolding wave 5 structure on the daily time frame. Despite recent downside pressure, the bullish outlook remains intact—as long as the market holds above $112,000, the August low. 📈 Current Wave Structure Bitcoin continues to print higher highs and higher lows. From the August low, we may be looking at a leading diagonal in wave 1, followed by a wave 2 corrective pullback If this holds, Bitcoin could be on the verge of a third-wave rally toward new all-time highs.
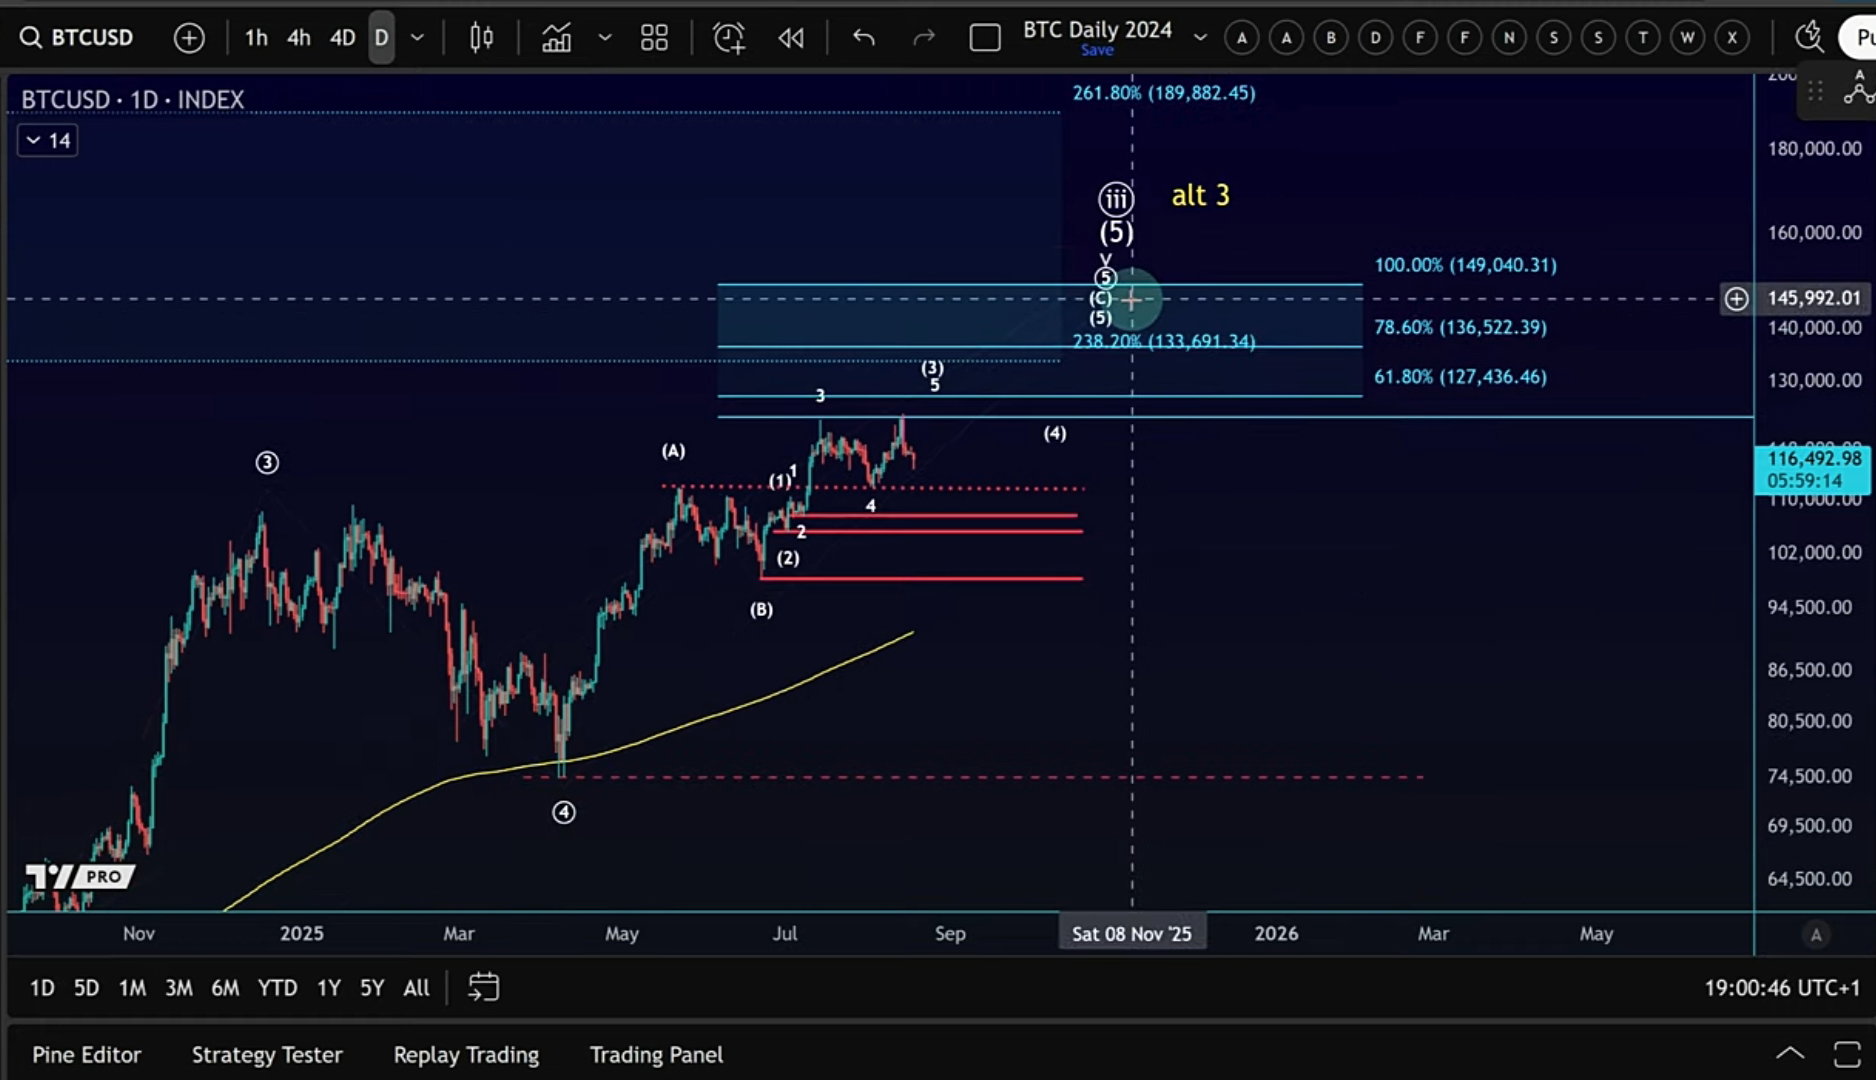
⚠️ The Concern: Weak B-Wave While the move down looks corrective, the structure of the decline isn’t ideal: The wave A was quite long. The B-wave appears weak, possibly a triangle formation. As a result, the C-wave down is short, making it harder to confirm if wave 2 has fully bottomed. 🔑 Key Support & Resistance Levels $114,471 → Must hold for wave 2 to remain valid. $113,290 → Next critical support. $112,000 → Formal invalidation point. A break below this would strongly favor the bears. On the flip side A break above $118,500 (B-wave high / end of triangle) would be the first strong signal that the low is in. 🚨 What Would Confirm a Major Top? If Bitcoin breaks below $112K and forms a five-wave decline, followed by a three-wave corrective rally, this would be the strongest warning that a major top has already formed. Still probabilistic, but historically a reliable structure. 📊 Conclusion Bias remains bullish above $112K. Watching for bulls to defend $114,471 support zone. Break above $118,500 would strengthen the case for a rally. But if $112K fails → bears may take the lead.
No comments yet