 @HuzaifaFarhad
more from that month
@HuzaifaFarhad
more from that month
🚀 Chainlink (LINK) Update: Two Bullish Scenarios in Play – Key Levels to Watch 📊 Chainlink (LINK) is showing strong bullish structures on both the **1-hour and 4-hour timeframes**, with two possible scenarios unfolding. Let’s break them down step by step. 🔶 Scenario 1: The Yellow Path (Wave 2 Pullback Possible) A **wave 2 bottom** may have formed in late June (around June 22). We then saw a **5-wave move up** (1-2-3-4-5), which could be complete. Currently, there is no *clear evidence* of a large pullback starting, but it remains a possibility. This could mean we’ve seen an **A-wave down**, a **B-wave up**, and a **C-wave down** might still be in play. **Key Support Zone:** $13 (critical structural + Fibonacci support). As long as LINK stays above $13, the bullish case towards **$47+** remains alive.
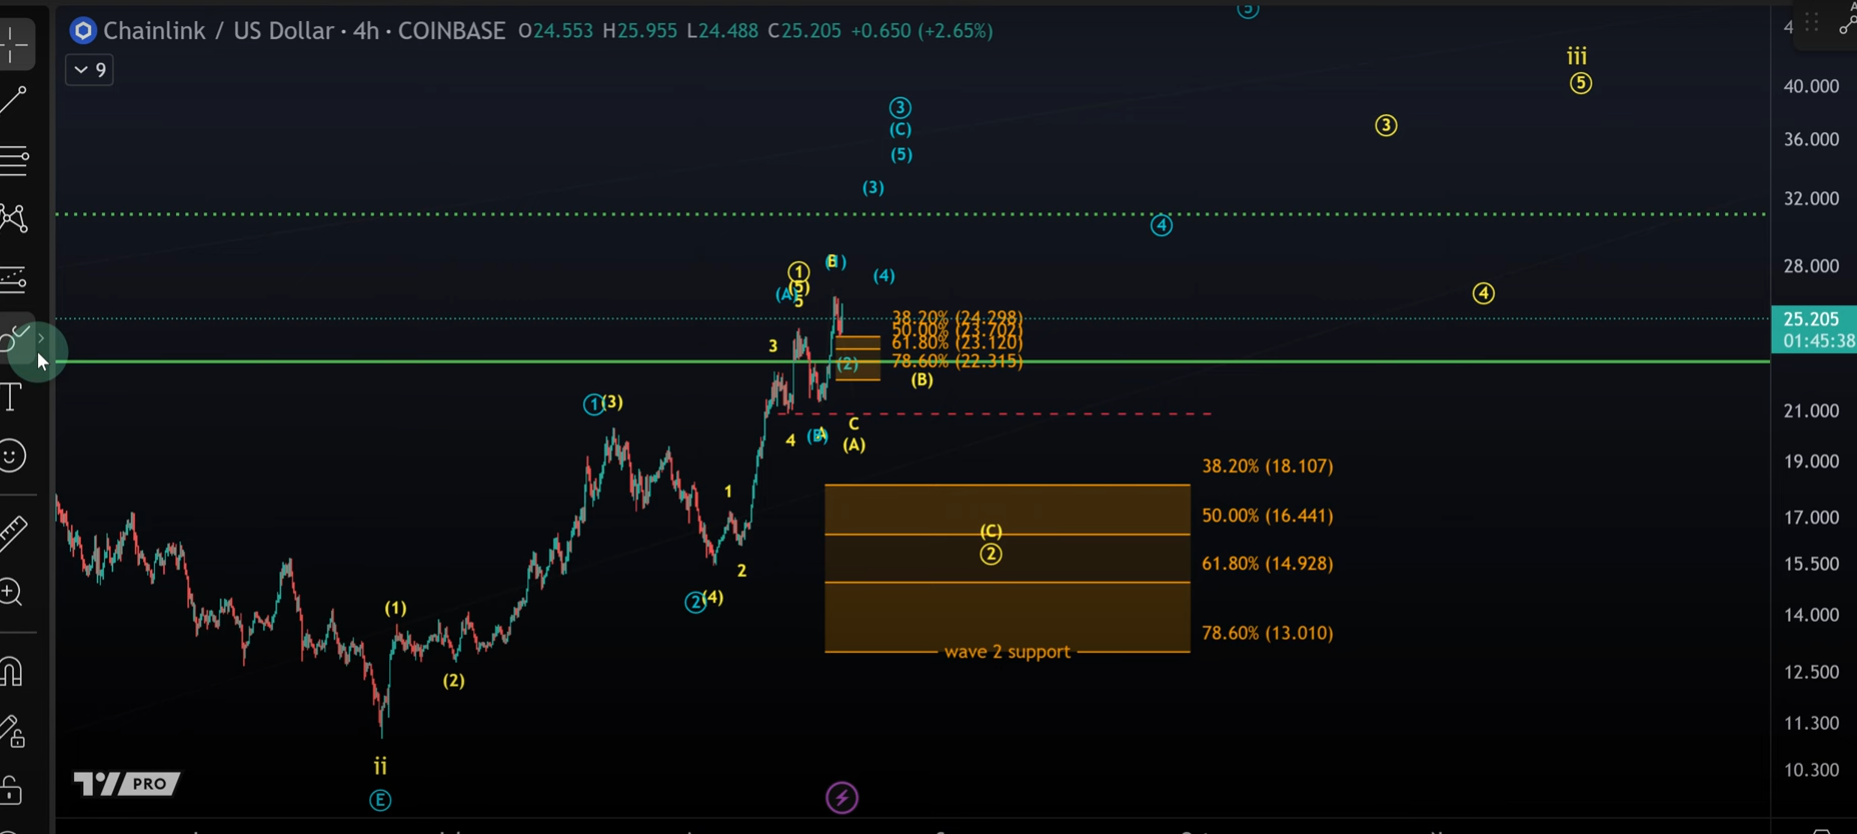
🔷 Scenario 2: The Blue Path (More Directly Bullish) A **B-wave bottom** may have formed on June 22. We’ve seen **3 waves up (wave 1)**, followed by a pullback (**wave 2**). The move from the August low looks like a **5-wave rally into the August 13 high**, followed by an **ABC pullback**, with a possible **C-wave up** unfolding now. **Immediate Resistance Levels:** $25 (breakout confirmation) $31 (next major resistance) **Next Big Target:** $47 if bullish momentum continues. **Micro Support Zone:** $22.31 – $24.29. Holding this area keeps the bullish momentum intact. A break **below $22.31** would shift probability back toward the yellow scenario (deeper pullback).
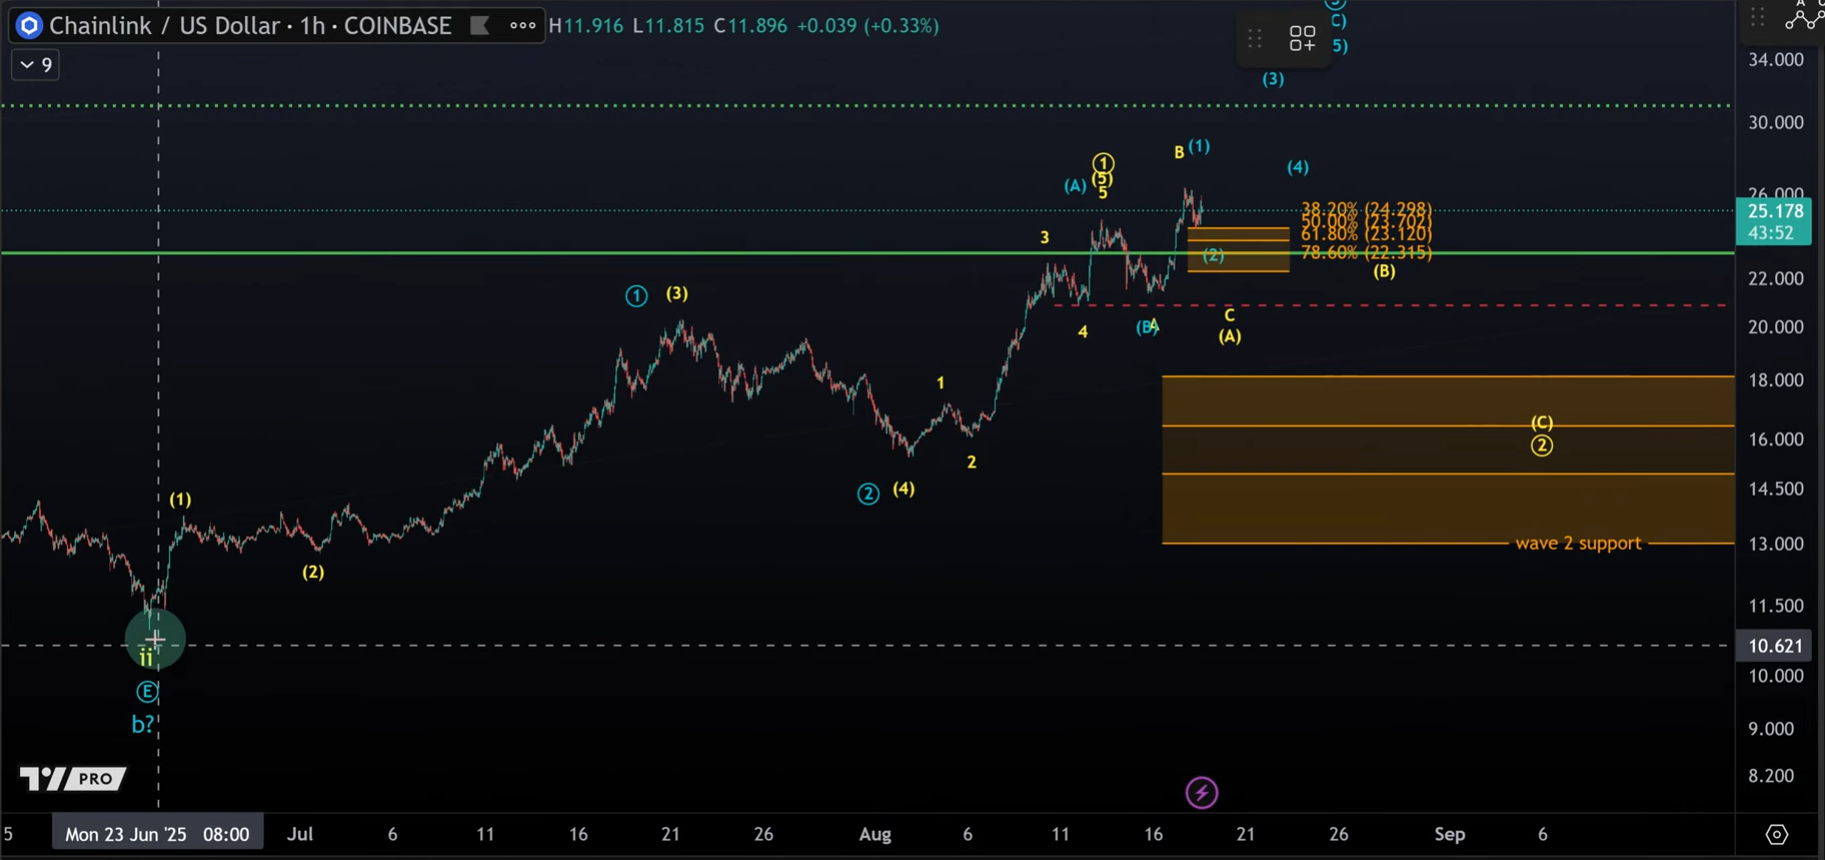
📌 Key Takeaways Both scenarios are bullish, but **the blue scenario is currently leading**. **Watch $22.31–$24.29 support** — holding it keeps the door open to higher prices. If LINK breaks above $25 decisively, the road to **$31 and eventually $47** opens up. Below $22.31 → probabilities shift to a deeper pullback (yellow scenario).
No comments yet