 @EnergyB0x
more from that month
@EnergyB0x
more from that month
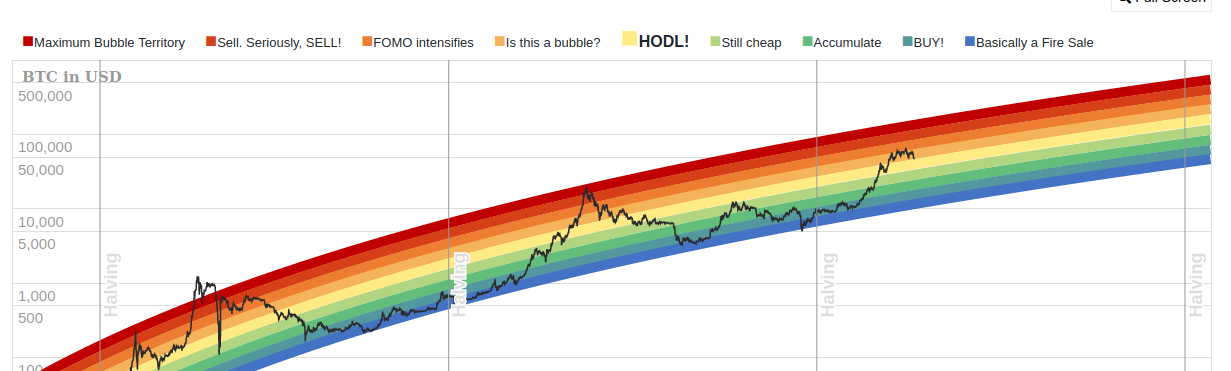
The Bitcoin rainbow chart is another interesting index, but not always predictive. It describes long term price movements, disregarding the daily volatility. Today we are regressing from SELL zone to FOMO one. More info here: https://www.blockchaincenter.net/bitcoin-rainbow-chart/
No comments yet