 @Cybertheus
more from that month
@Cybertheus
more from that month
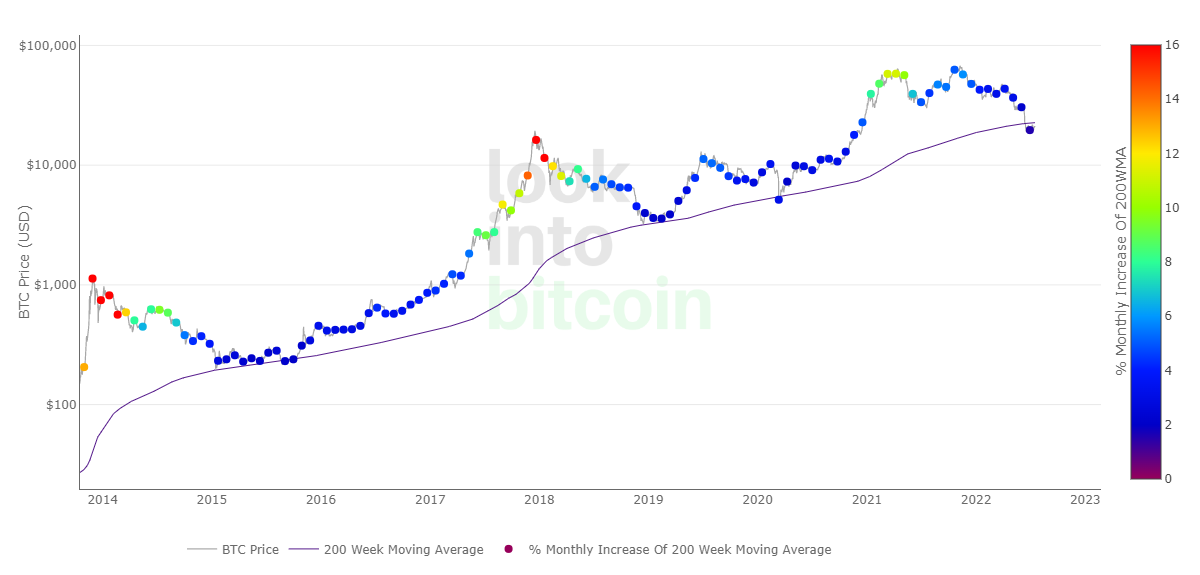
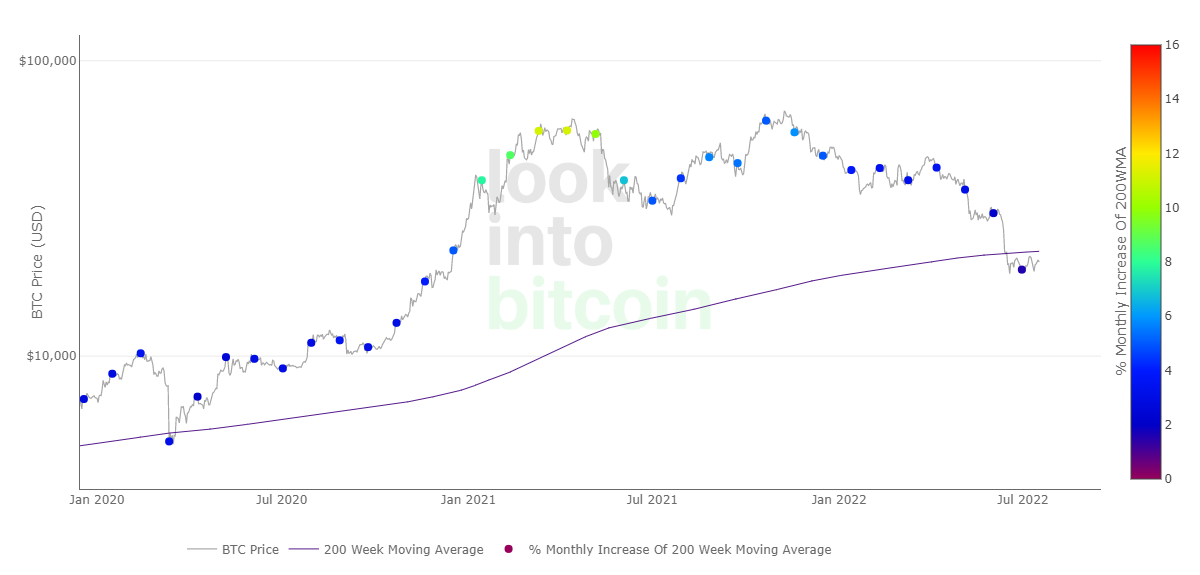
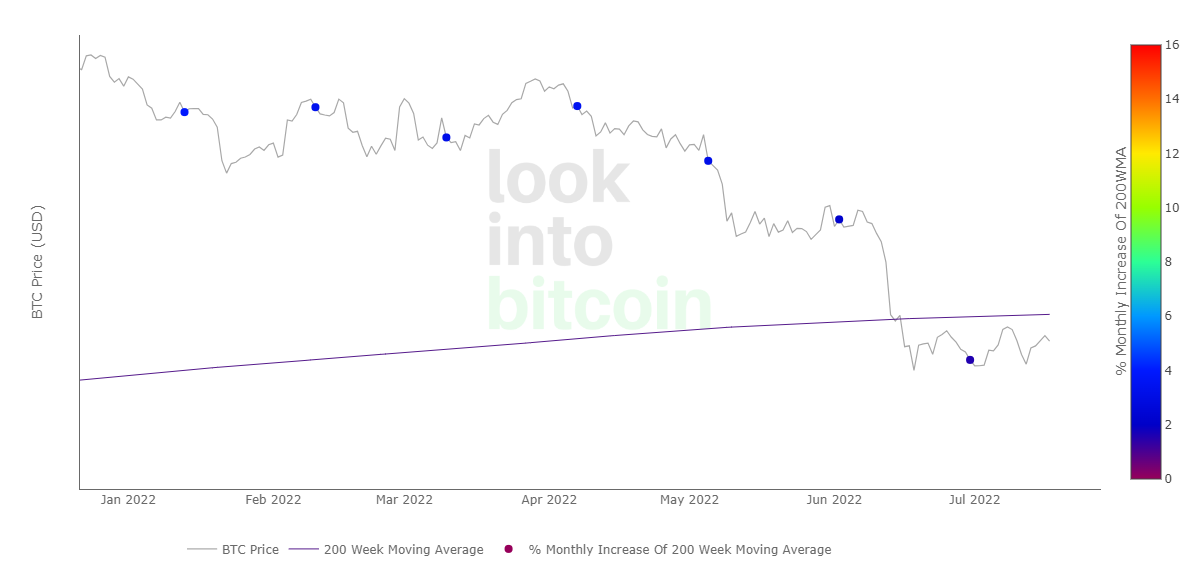
📊 According to the heat map and 200-week moving average, the price of bitcoin is now at the bottom The price of Bitcoin is below the 200-week moving average. Historically, this corresponded to finding the price of bitcoin at the bottom, followed by an increase in its value. Thus, the current price of bitcoin according to this chart is «cold», that is, it has a significant potential for growth. Accordingly, finding the price of bitcoin at or below the 200-week moving average has historically been a good buying point. This chart is a long-term investment tool. #bitcoin #btc #cryptocurrency #crypto #cryptotrading
No comments yet