 @Cryptoarmy
more from that month
@Cryptoarmy
more from that month
Technical Analysis: Bitcoin Cash 19/12/2020

In this article we are going to discuss recent price of BCH, possible targets, support and resistance levels. Please remember that this is not a financial advice, trade wisely. This is a brief technical analysis based on multiple indicators that have been in a constant change lately, but most importantly in a clear trend till this moment. In the chart below, you can observe a 1 hour timeframe chart of BCHUSDT. In this chart, and as we previously mentioned on this site, we expected BCH to retest the resistance level of 315$. BCH was able to break through 315$ levels, but what next? In this chart you can observe the red lines as support lines, green lines represent resistance lines and take profit targets. **General Trend** : Bullish Trading above 200 EMA **Current Price : 317.78$** **Support Lines**: Based on previous tested levels: 315$ 294$ 260$ 235$ Based on trend line: 284$ 268$ **Resistance lines** : Based on previous tested levels: 327$ 348$ 368$ Based on TA, being able to break through 368$ will lead to a massive pump in the price and may lead us to **440$** **Based on EWT:** If this is the first impulsive wave, we may see a retracement to 308-310$ before the continuation of the trend and reaching 345$. It is very important to hold the support levels of 315$ and 294$. Due to that the general trend of the market is bullish, it is only recommended to long BCH, unless we suffer of a trend reversal.
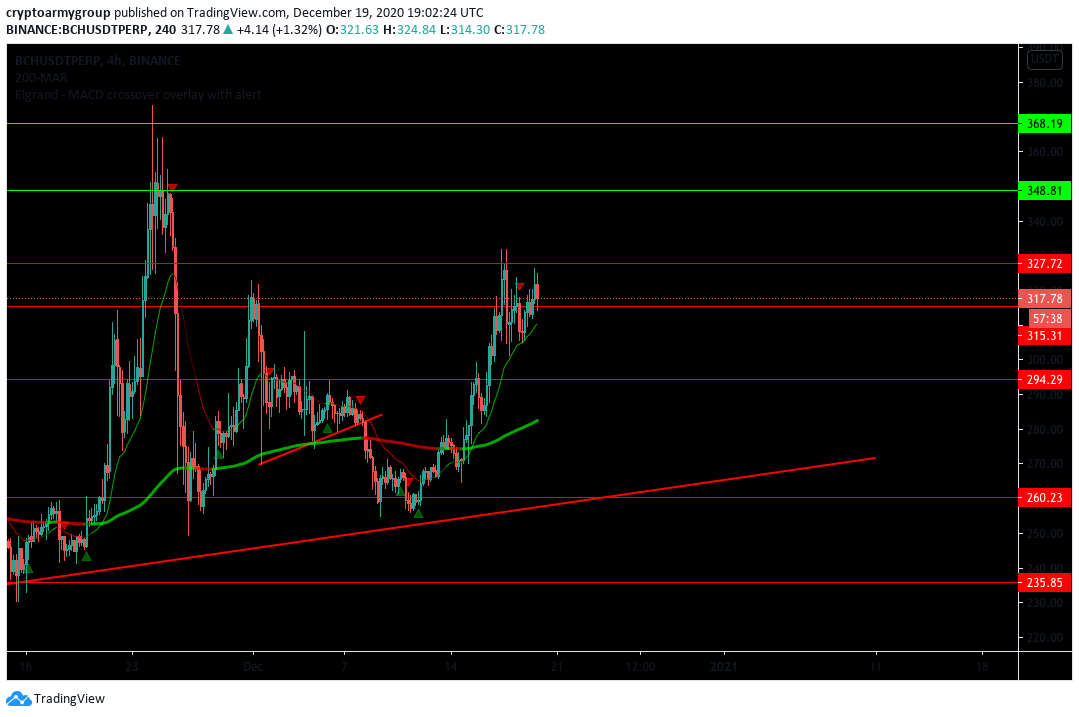
This was a brief TA of BCHUSDT, please trade wisely, plan your trades, set your stop loss based on the ATR indicator on 4hr timeframe chart. Thanks for your attention, Crypto Army
No comments yet