 @BitcoinBaby
more from that month
@BitcoinBaby
more from that month
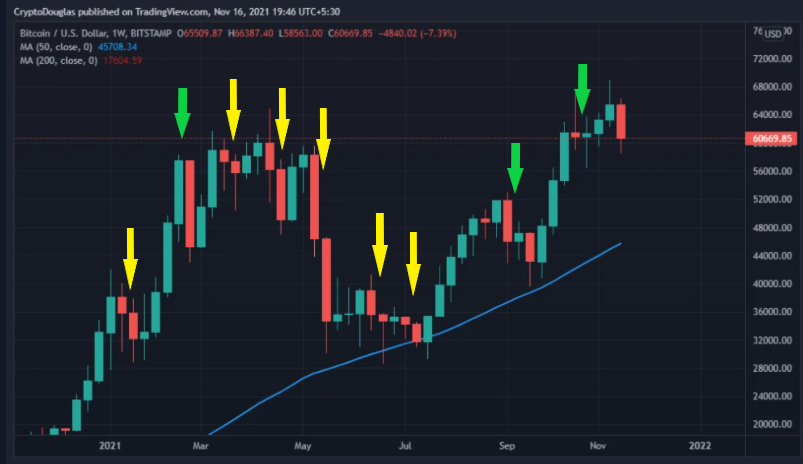
I was just looking at the weekly charts for the last year and especially the previous peak to see how often we dipped before going up...and what I noticed was that often when we dip...it´s a 2 week dip..... and the 2nd week is worse.. those are the yellow arrows. And the other scenario is that we just move up a little from the bottom of the previous week in the 2nd week... the green arrows. In most cases the 3rd week after the dip ends positively...but afterward we dip again. Guess what I am trying to say is if this dip is not corrected by the end of the week...we can look forward to a further dip next week....and selling pressure in the week after that. Just my thoughts of course. #CryptoTrading
2 comments
You might be right
Indeed I might be ;)