 @BitcoinBaby
more from that month
@BitcoinBaby
more from that month
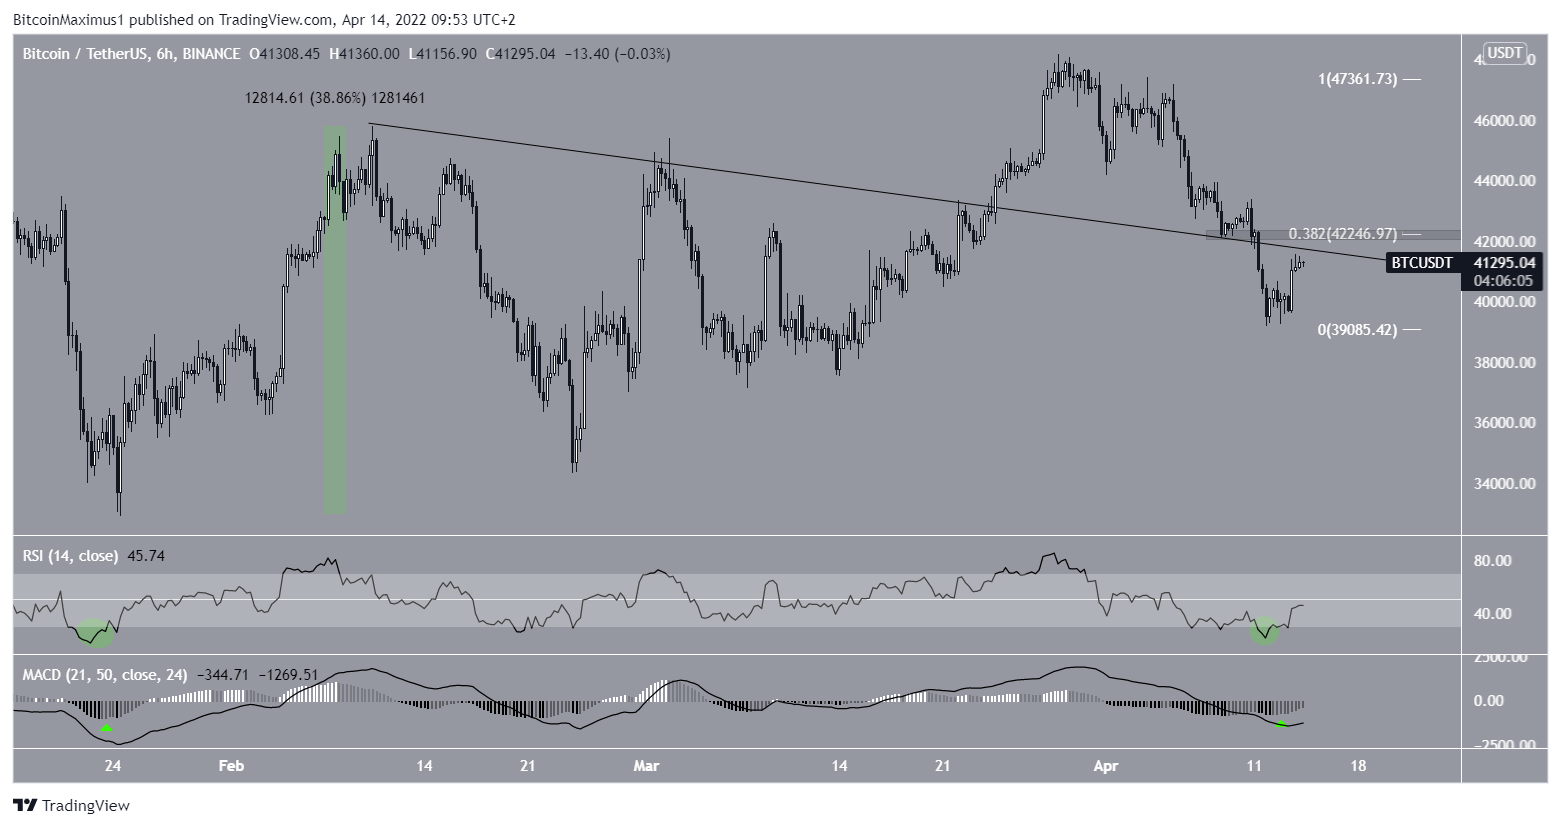
𝐂𝐫𝐲𝐩𝐭𝐨 𝐖𝐞𝐚𝐭𝐡𝐞𝐫 𝐅𝐨𝐫𝐞𝐜𝐚𝐬𝐭 This forecasting thing is more difficult than one might think. To do it right you have to read a lot and investigate a bit more. You have to risk being wrong, knowing you´re more often right. That´s why sometimes I just skip a day, like yesterday. I just could not find the data I needed to say something semi-rational. But I found you guys and dolls some very interesting info, and even though I am still bearish this info is showing bullish signals....which is great as I spend all my stable coins on buying this dip. So what is the news the six-hourBitcoin chart both RSI & MACD show as extremely oversold. RSI has not been this oversold since Jan. 24 (green circle). Similarly, the MACD is deep into negative territory and has given a bullish reversal signal (green icon). The previous time both these signals occurred, BTC initiated an upward move with a magnitude of 40%. These data points underline the expectation of a huge breakout for Bitcoin in the 2 weeks after easter. This means I have to be patient for at least another week and hold my breath every time I see BTC take a dump. But I guess I can hold on for one more week and grow some more grey hairs, hoping my bearish mood will melt away. #Crypto
No comments yet