 @BOMBERuss
more from that month
@BOMBERuss
more from that month
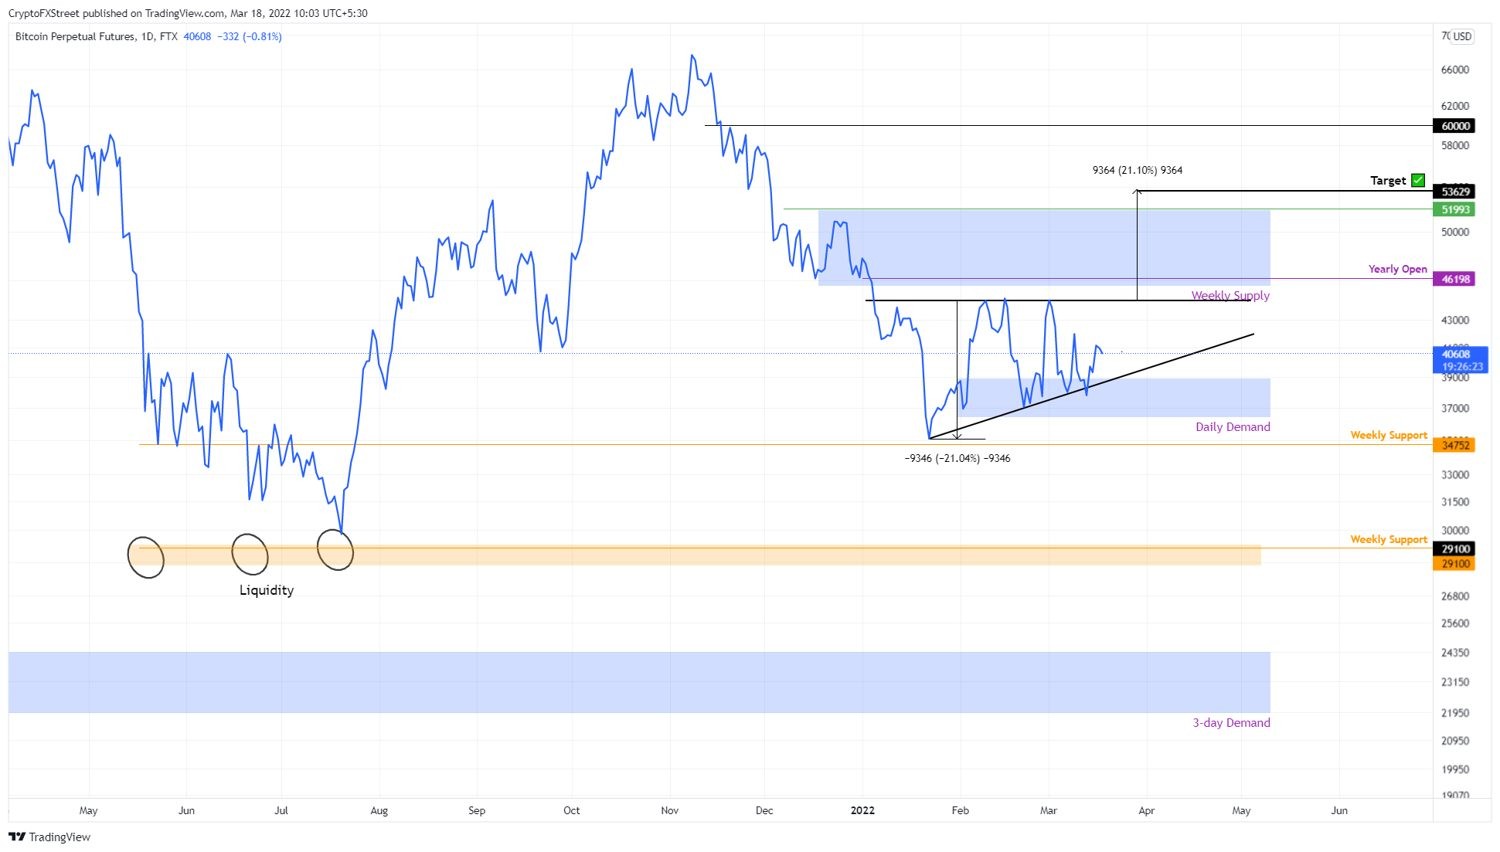
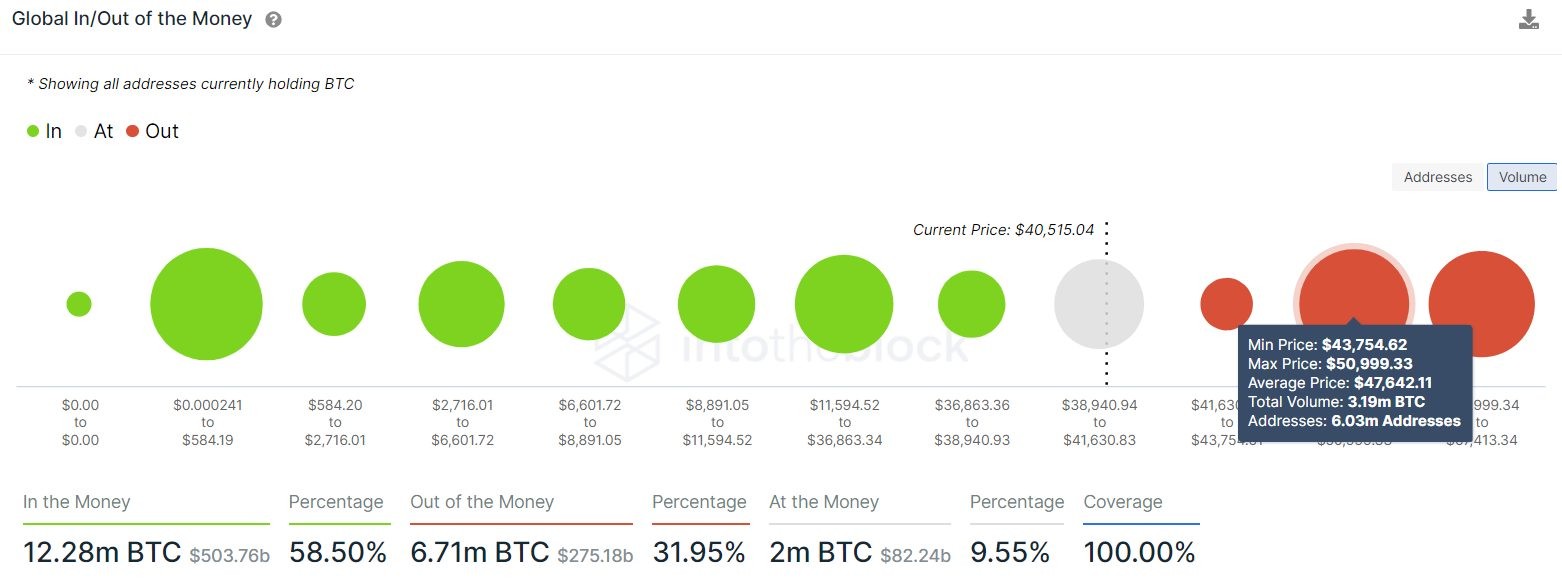
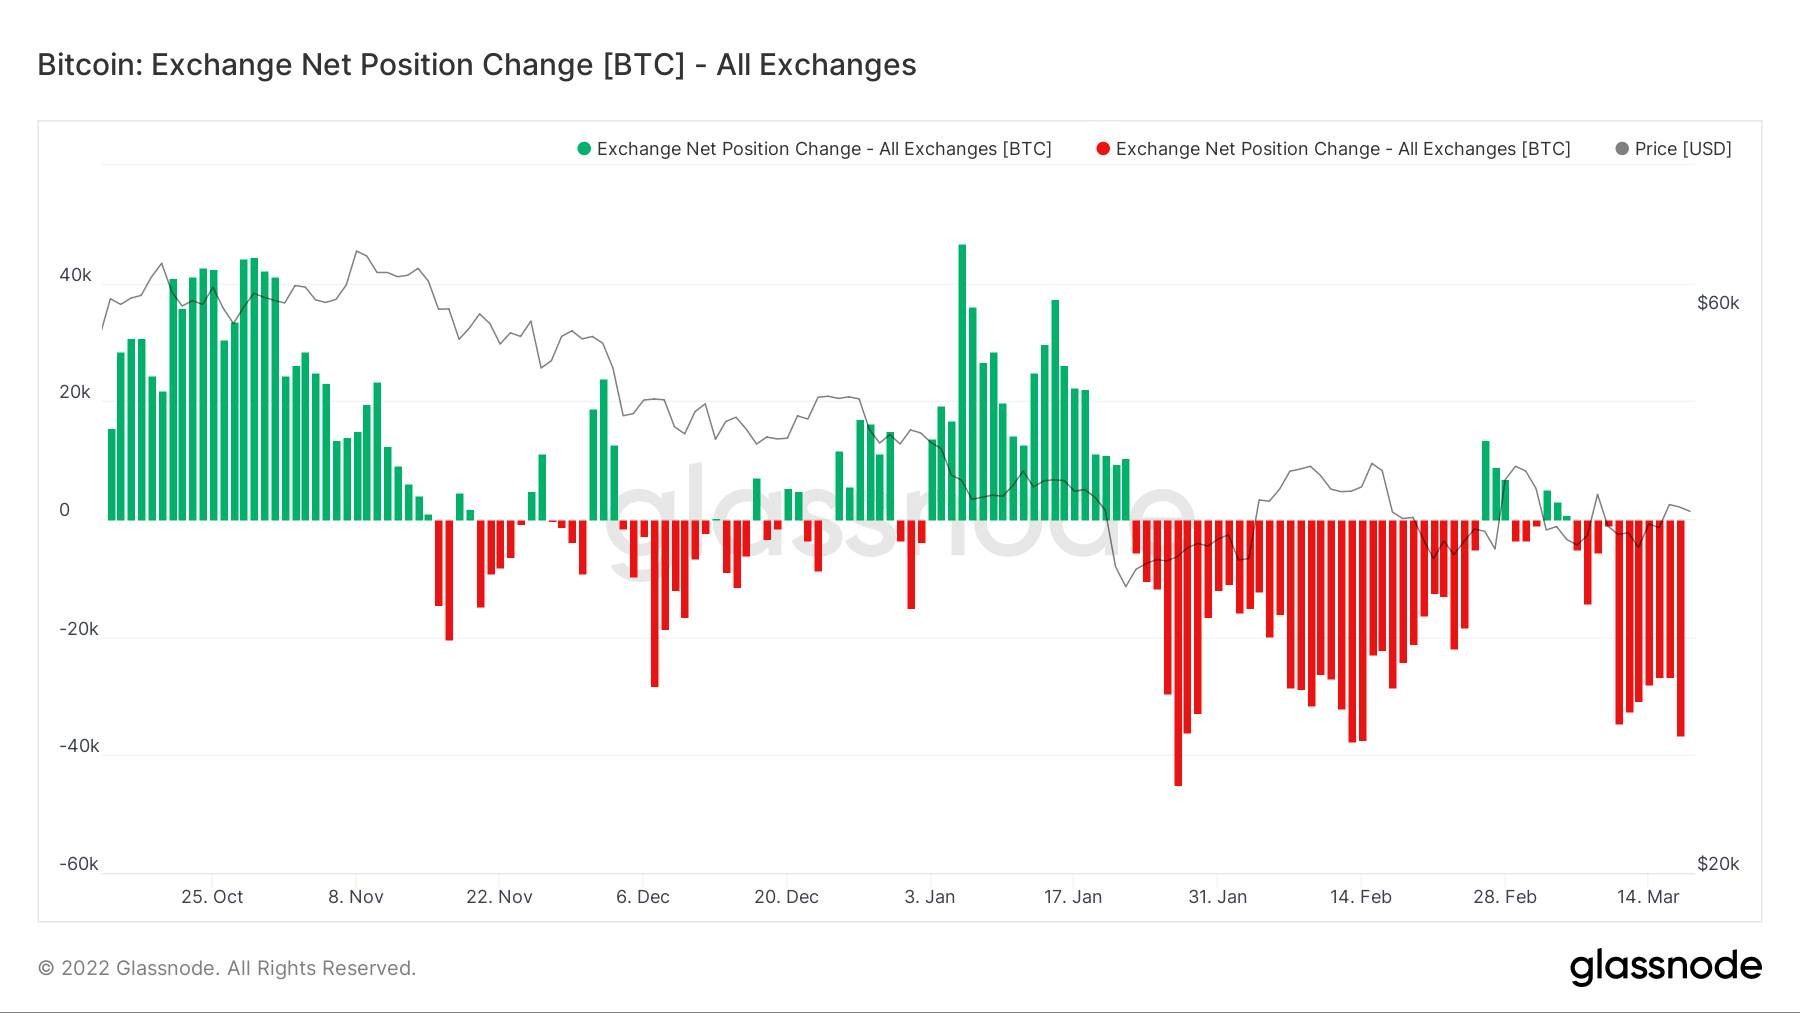
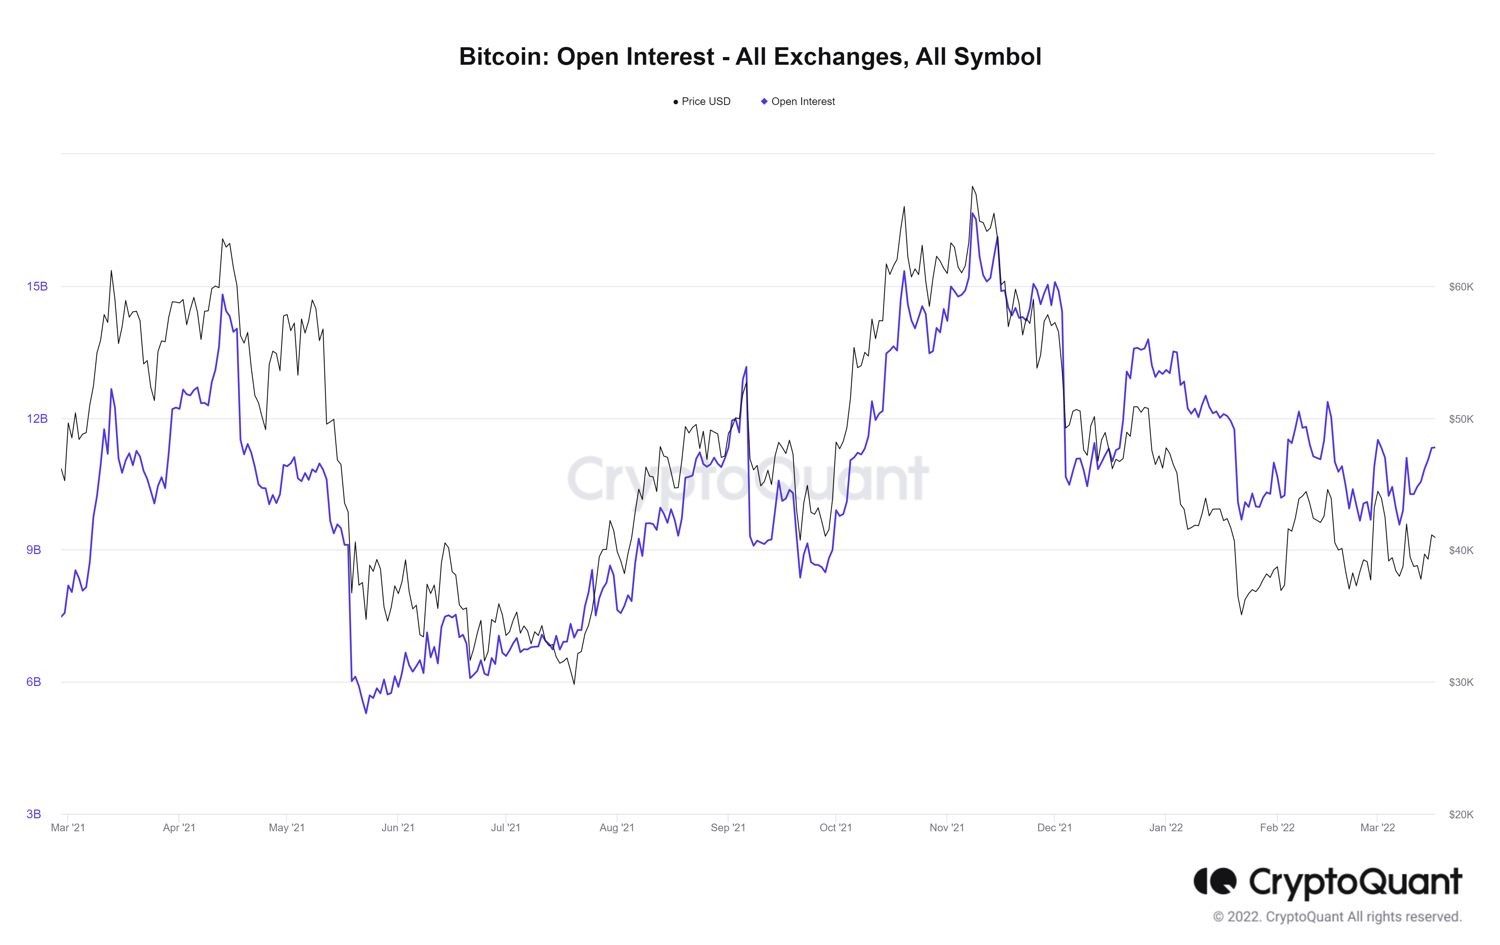
The consolidation of the #bitcoin price continues with the formation of bullish settings. The breakthrough of this formation may be the key to launching a bull market, network metrics and market indicators also speak in favor of this. Since January 22, the bitcoin price has set three equal highs and four upper lows. These oscillation points can be connected by trend lines to form an ascending triangle. This technical formation predicts a 21% rise, obtained by adding the distance between the maximum and minimum of the first swing to the breakout point at $44,418. A decisive close above the horizontal resistance barrier at $44,418 will mark a #violation of this model and cause a movement of 21% to $53 629. Closing the daily candle above $52,000 creates an upper maximum and indicates the beginning of a bullish rally. In this case, the bitcoin price is likely to set an upper minimum and reach a psychological level of $60,000, and possibly a historical maximum of $69,000. This upward movement is facilitated by the global model Into The Block In/Out of the Money (#GAME). This index shows that the area of the nearest resistance, extending from $41,600 to $4,750, is weak and a transition to $47,642 is likely. Here, approximately 6.0 million addresses that bought almost 3,2 million BTC turned out to be "without money". Thus, the movement into this area will be met with pressure from sellers from investors trying to break even. Unlike the technical data, the transaction data suggests the possibility of a bullish move, but this forecast seems to be limited to $50,000. The bulls are given hope by the indicator of changes in the net position of the exchange, which is currently in the red zone, which indicates a net outflow of IES. Approximately 36 600 #BTC left centralized organizations on March 11 and 13 000 - on March 16. If the net flow has turned slightly positive today, the massive capital outflow over the past week indicates that institutional investors or high-income investors are optimistic and are transferring their assets to cold wallets in anticipation of a rally. The bullish thesis looks convincing and supports the possibility of bitcoin price growth, however, the open interest (OM) chart does not correspond to the optimistic forecast. Since January 12, the OI has fluctuated between 12.5 and 9.6 billion. Recently, this number has fallen to 11 billion and has been trending downward since November 8, 2021, which indicates the lack of activity of cryptocurrencies. This forecast supports the assumed leverage ratio for the bitcoin price. A high coefficient indicates that many investors are trading with absurd leverage. Such market conditions do not support bullish movement. Often a tiny spike against the expectations of these traders is likely to lead to massive liquidations, reset the landscape and allow smart money to take long positions. Thus, futures traders should keep a close eye on this chart, as it indicates the possibility of capitulation. In addition, this indicator has always fallen before a full-fledged reversal, an example of this is the collapses in March 2020 and September 2021. Moreover, on March 15, the calculated leverage ratio reached a new historical maximum of 0.218, which once again shows how much the market is screwed up. #CryptoCurrency
No comments yet