 @BOMBERuss
more from that month
@BOMBERuss
more from that month
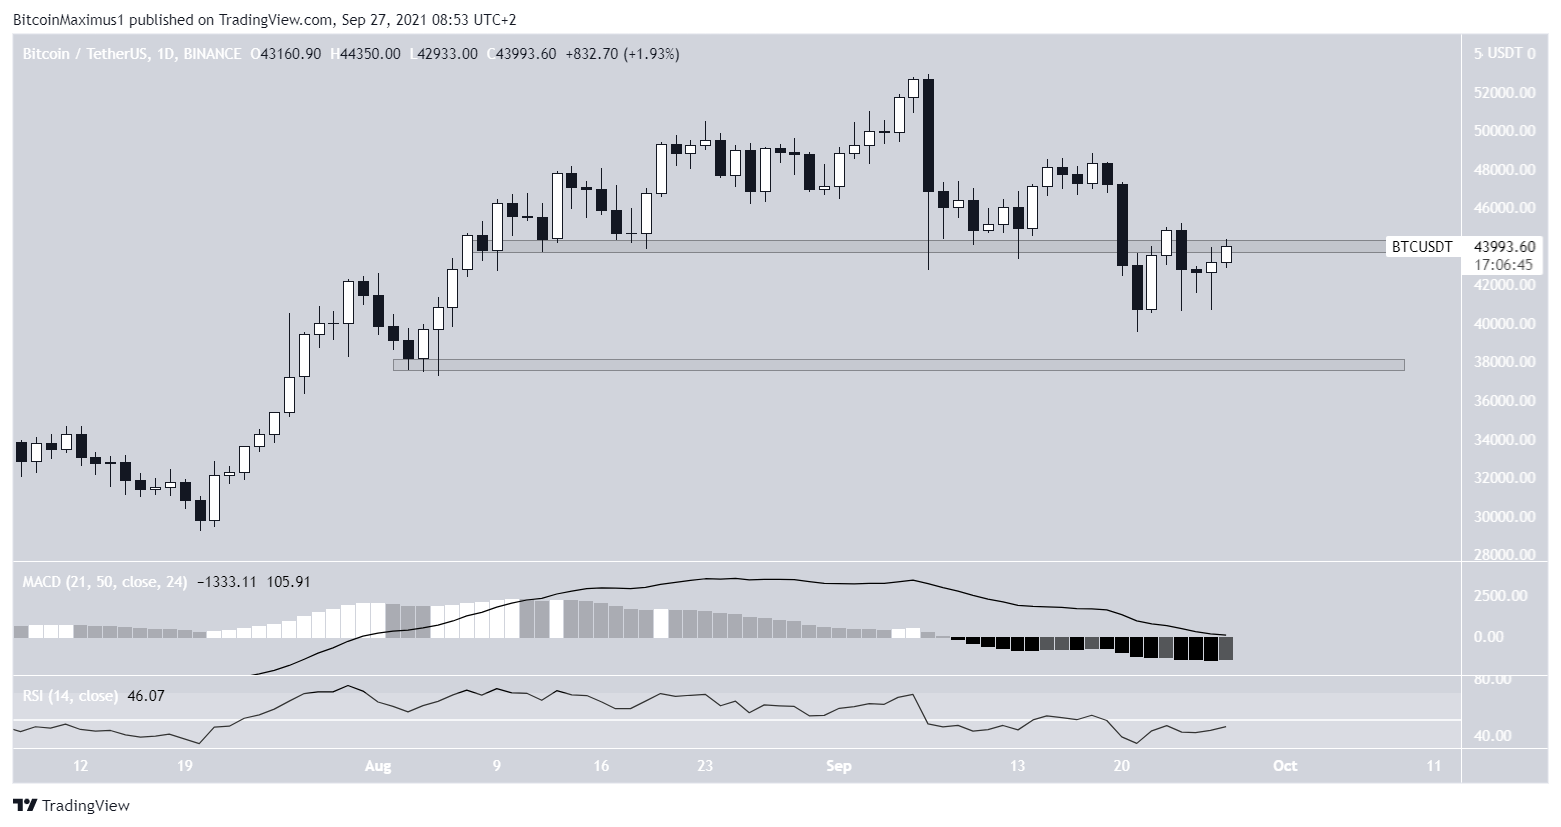
Bitcoin has been declining since it made a bearish breakdown of the ascending support line and turned it into resistance. In addition, the price bounced off the bearish supertrend line (red line). On September 26, the BTC exchange rate formed another bearish candle, although it is distinguished by a long lower wick. The RSI and MACD indicators give mixed signals. The MACD has not yet signaled a bullish reversal, and the RSI index has risen above the 50 mark, but does not show signs of strength. Accordingly, in order to determine the likely direction of the future trend with greater accuracy, we will need to analyze shorter timeframes. On the daily chart, bitcoin faced resistance around $44,000. Earlier, in August and September, this area played the role of support, but then BTC broke through it. On September 24, the market tried to recover above this level, but failed. As on the weekly charts, technically the indicators give contradictory signals. The MACD is also positive, but it is declining, and the RSI index is moving north, but has not yet crossed the 50 mark. The nearest support is located in the area of $38,000. On the 6-hour chart, bitcoin has been trading inside a descending parallel channel since September 7. As a rule, corrective structures are formed inside such channels. Accordingly, the most likely scenario will be a bullish breakout from this channel. The results of the wave analysis suggest that, most likely, such a breakthrough will actually occur. The same probability is supported by the growing MACD and RSI indicators. #CryptoTrading
No comments yet