 @BOMBERuss
more from that month
@BOMBERuss
more from that month
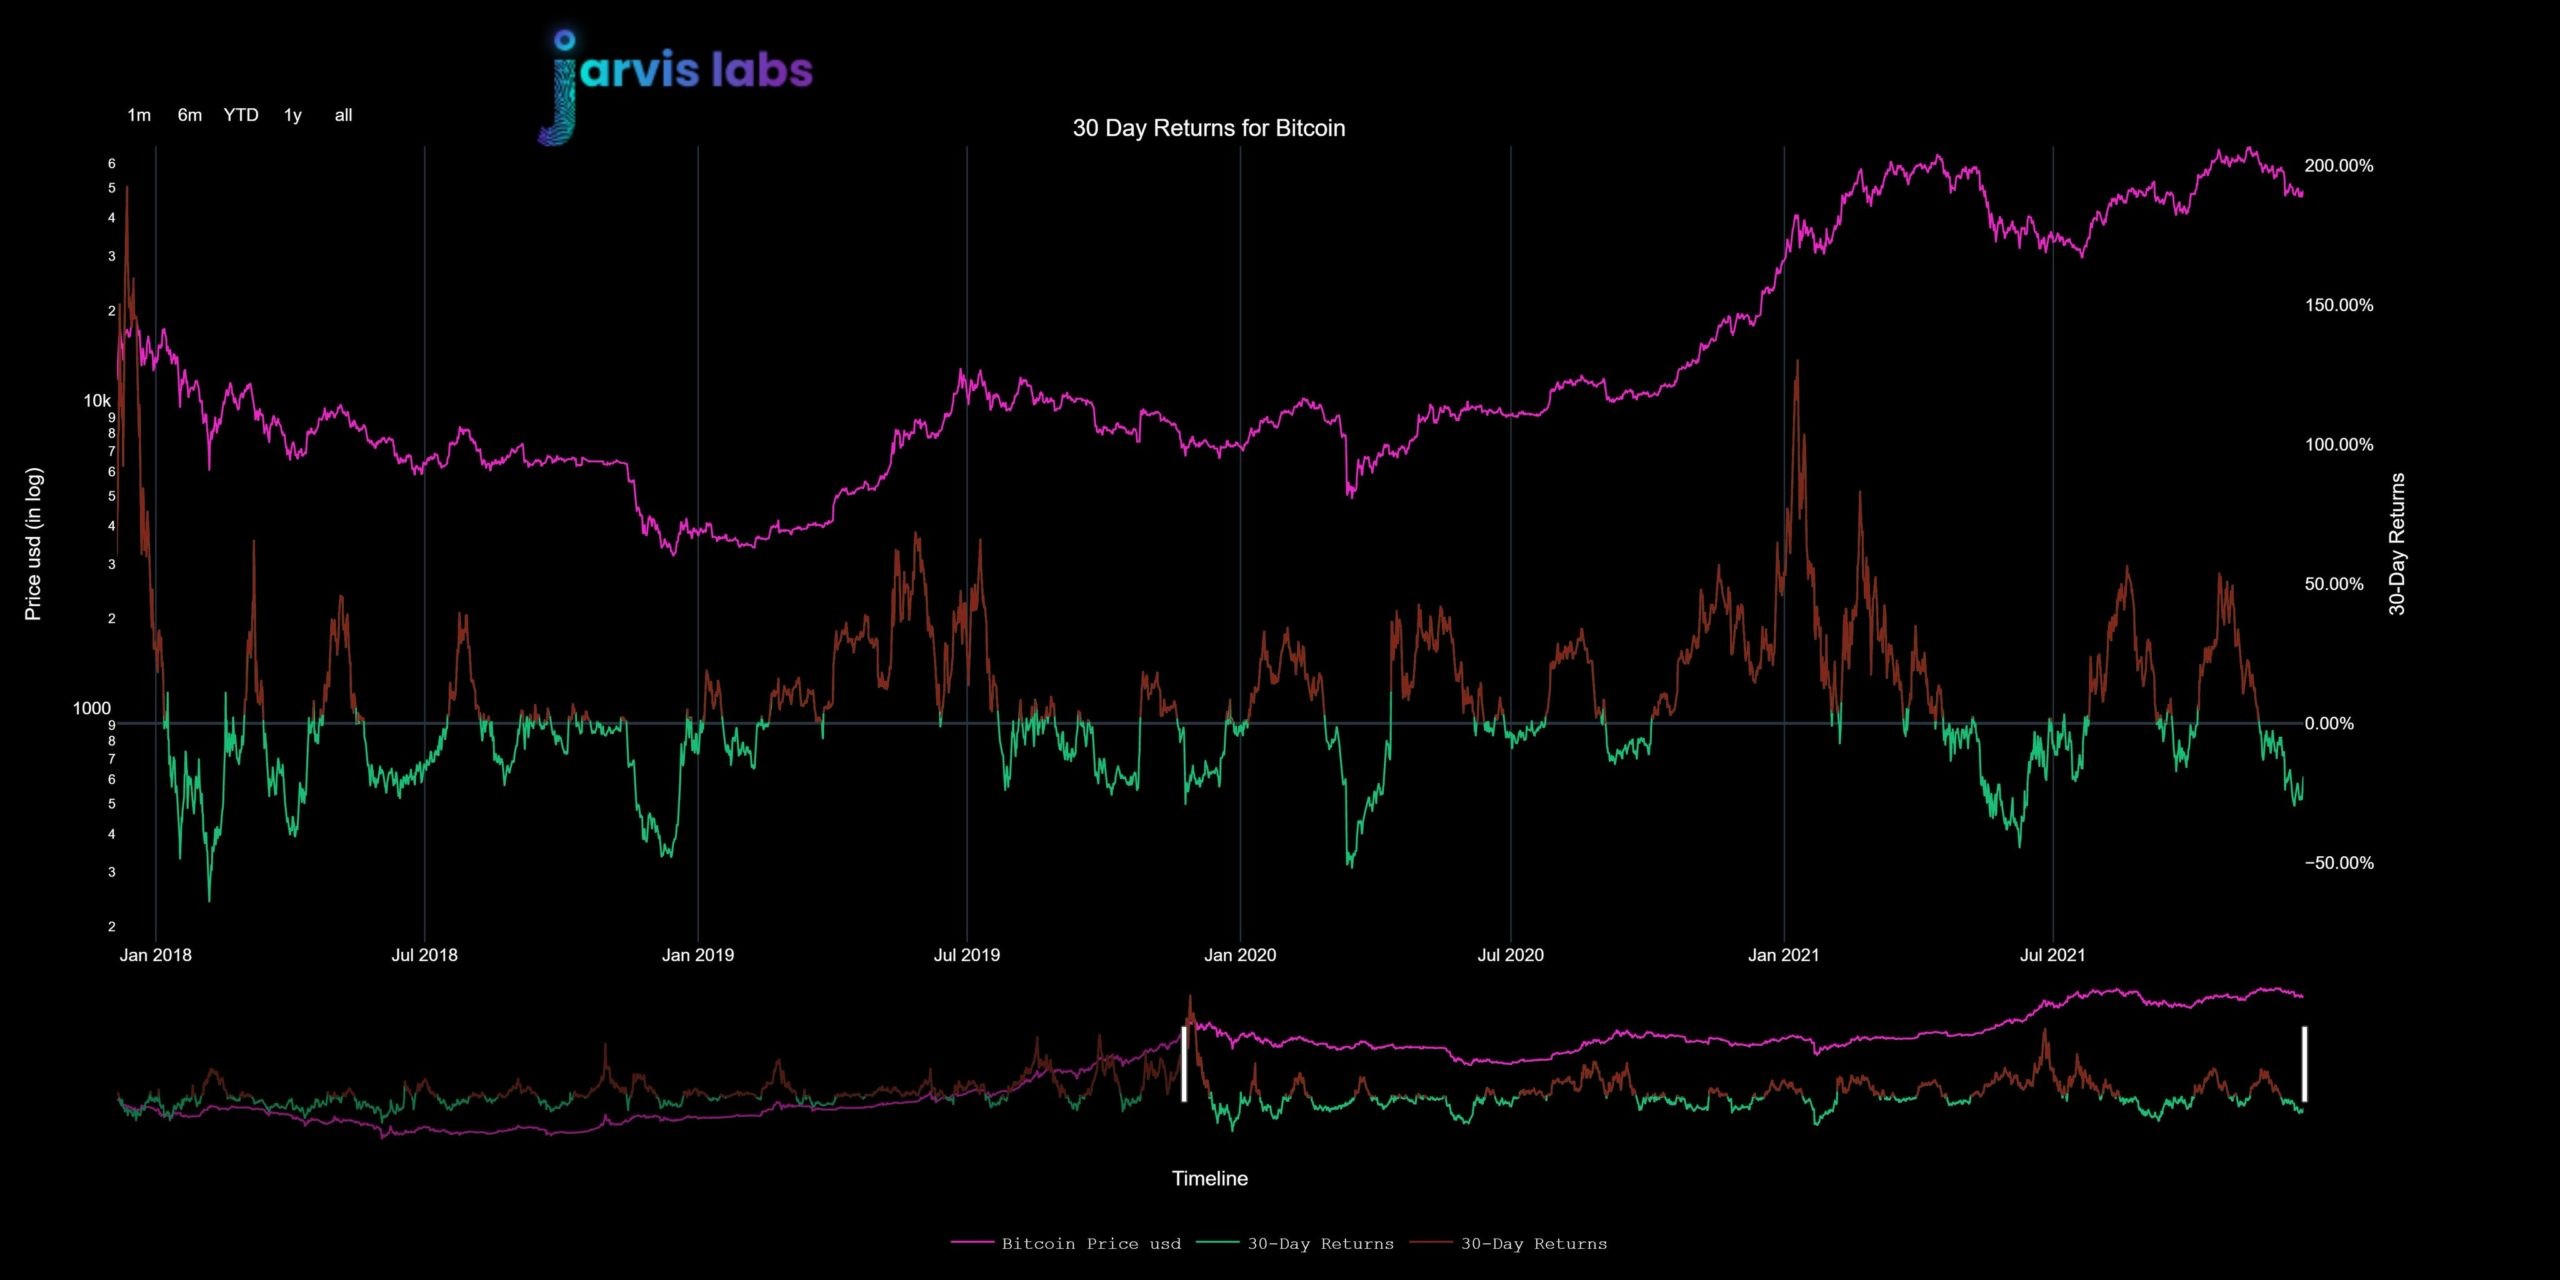
Let's go through the metrics and try to formulate assumptions about what to expect next from the BTC market. The 30-day BTC yield, which has been declining for some time, seems to have reached the bottom and is starting to form large lows (bullish divergence with price). This is good in the short term. Probably, in the coming weeks we will see the indicator return back to 0%. The accumulation trends indicator with a period of 7 days indicates the active participation of retail players, while for a period of 30 days there is a significant accumulation on the part of whales in the current range. The supply sensitivity model is based on the supply dominance coefficient of stablecoins and BTC. This metric reflects the medium-term trend and is now in the red zone. If the chart turns green, we can expect several weeks of market growth. The circulation coefficient is calculated based on the number of unique tokens moved over a certain period of time. This indicator should fall to the lows for the formation of a multi-year bottom and the subsequent large-scale rally. The net profit/loss indicator produced several long red bars indicating that many late buyers were selling at a loss. Well, good riddance, in general. The model based on the theory of liquid supply shock is still in the green zone. I would really like the price trend to return to growth before this indicator turns red. The average realized price for short-term holders is about $53 thousand. The same zone accounts for many of the expected resistance levels. Until the market recovers above this level, caution must be exercised. Wealth Multiplier (wealth coefficient, I would say), begins to form large lows (bullish divergence with price). This is an indication that somewhat greater stability is probably ready to return to BTC in the next few weeks. The indicator of the change in the ratio of open interest to market capitalization shows a significant decrease: a sign that most of the leverage has already been washed out of the market. If this indicator starts to grow against the background of continued price consolidation, it is likely to be a bullish signal of an impending short-squeeze. It is rather strange that the financing rate on Binance has not yet switched to negative values. There were several visits to the territory of negative rates on FTX, but they were short-lived. Of course, I would like to see negative financing for some time on Binance, on futures with a margin in USDT. Very few futures trading pairs on Binance have negative financing. Hopefully, 20+ more pairs will be added to them in the coming weeks. The net inflow of capital to the exchanges for BTC becomes positive. Not the picture I would like to see. Summarizing: Our ROSI indicator (mentioned here) it signaled the achievement of a local bottom at $42 thousand. There is still room for reduction in the financing rates of perpetual futures on BTC. The net inflow of BTC to exchanges is becoming positive, and this is an undesirable factor — a positive sign would be its return back to negative territory. BTC is trading slightly below the average cost for short-term holders ($53 thousand), and this level would need to be restored in the near future. So far, consolidation and "haircut" in the market are continuing. Long-term owners are still holding on tight (that's why they have "strong hands"). The potential route for BTC, as we see it today: -> $42 thousand ($44 thousand) —> $54 thousand. You can look at Metaverse and L2 altos in search of higher returns when BTC forms the bottom and begins a full-fledged rebound (relief rally, "relief rally"). The rally in the first quarter is likely to be a reasonable time to take profits on most medium-term positions.
No comments yet