 @BOMBERuss
more from that month
@BOMBERuss
more from that month
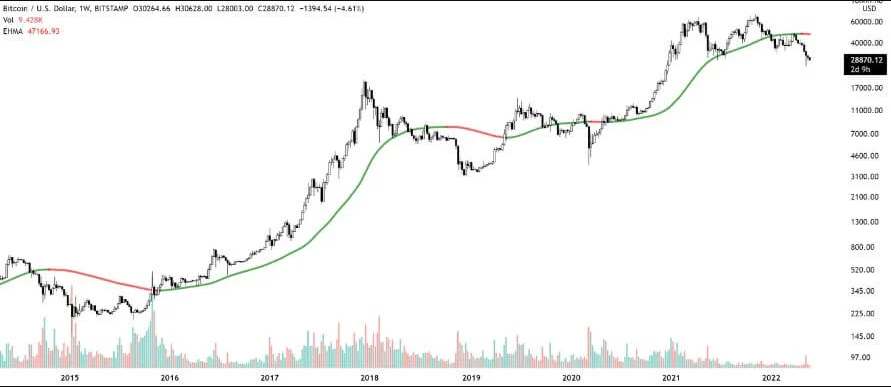
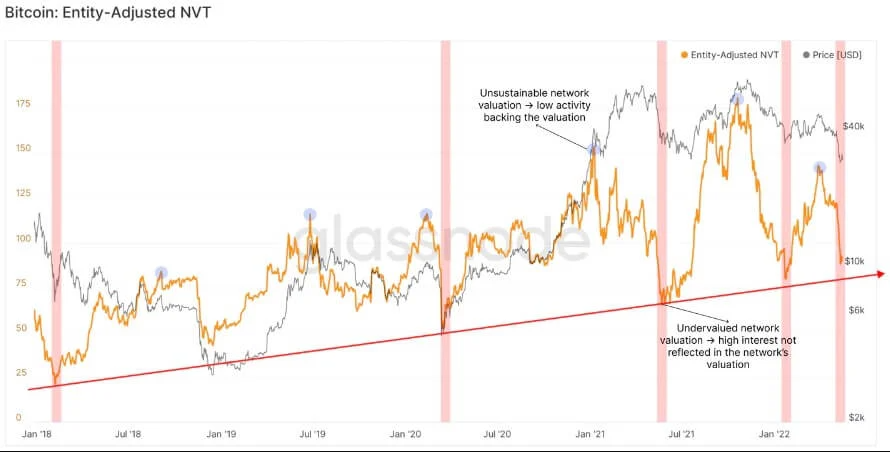
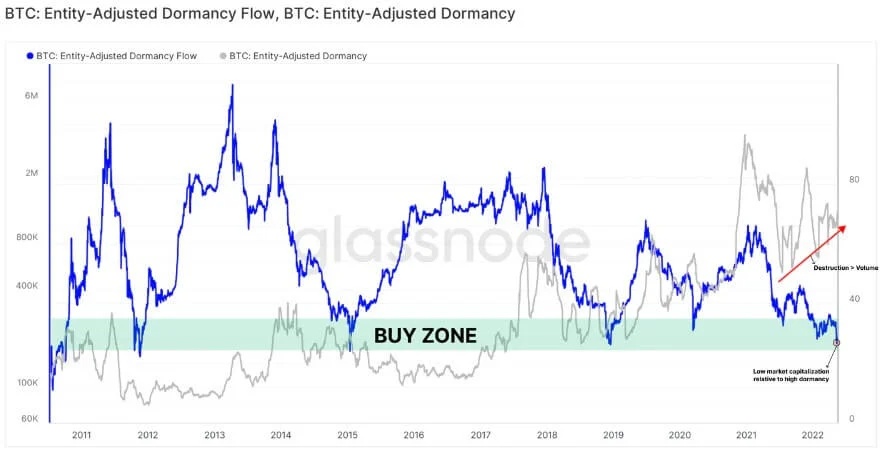
While #Bitcoin is trading below $45,000, traders have more reasons for skepticism than positive signs of growth. An exponential moving average with a period of 180 on the scale of weekly candles can be considered a good indicator and the nearest target on the #BTC chart. A break above this line usually indicates a powerful upward jerk of the price (scr. 1). Despite the rather "gloomy" analysis, there are several signs that the market is already in the process of finding a bottom. According to the latest report of the #Glassnode platform published by #Cointelegraph, after the Bitcoin exchange rate fell below $ 30,000 in early May, "activity in the #cryptocurrency network increased as an increasing volume of coin supply changed hands, while the network was losing its value." (scr. 2) That's how experts interpret it. "This phenomenon historically #signals a great opportunity to buy BTC." As an additional confirmation of the theory that Bitcoin is currently in the buying zone, the report indicates a stream of "sleeping" coins adjusted by the number of crypto wallets. It is consolidating in an area that was previously considered the optimal buying zone (scr. 3). Although numerous reports confirm that the crypto market is in a bearish trend, there are signs that the "exhaustion" of sellers may have reached its limit. It remains to "find the bottom" — that is, to reach the point at which most traders will agree on the benefits of buying BTC. Most likely, this point is located closer to the $20,000 line — although this is only one of the possible versions. #CryptoCurrency #analytic
No comments yet