 @BOMBERuss
more from that month
@BOMBERuss
more from that month
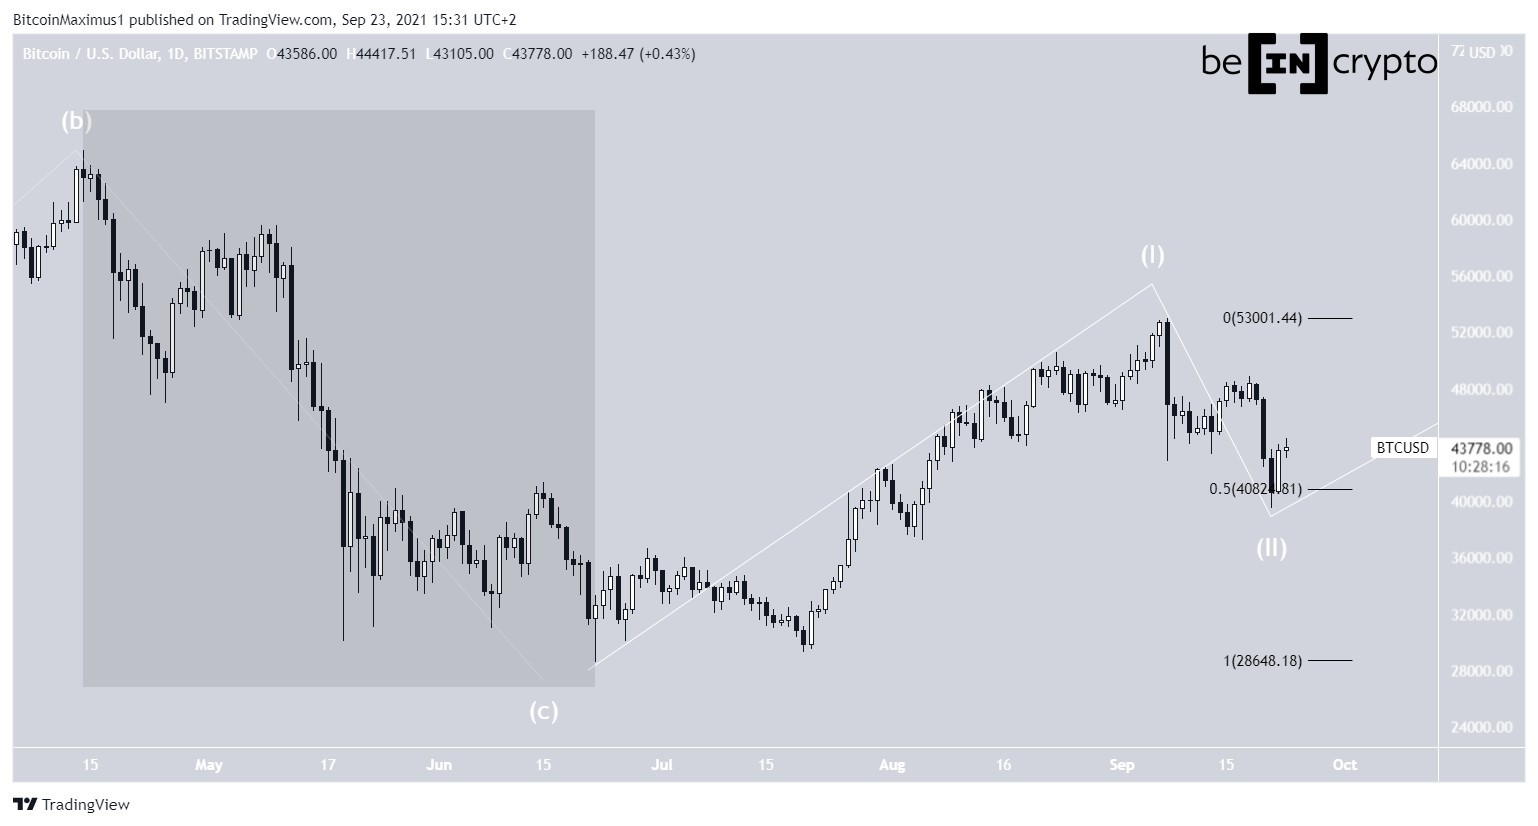
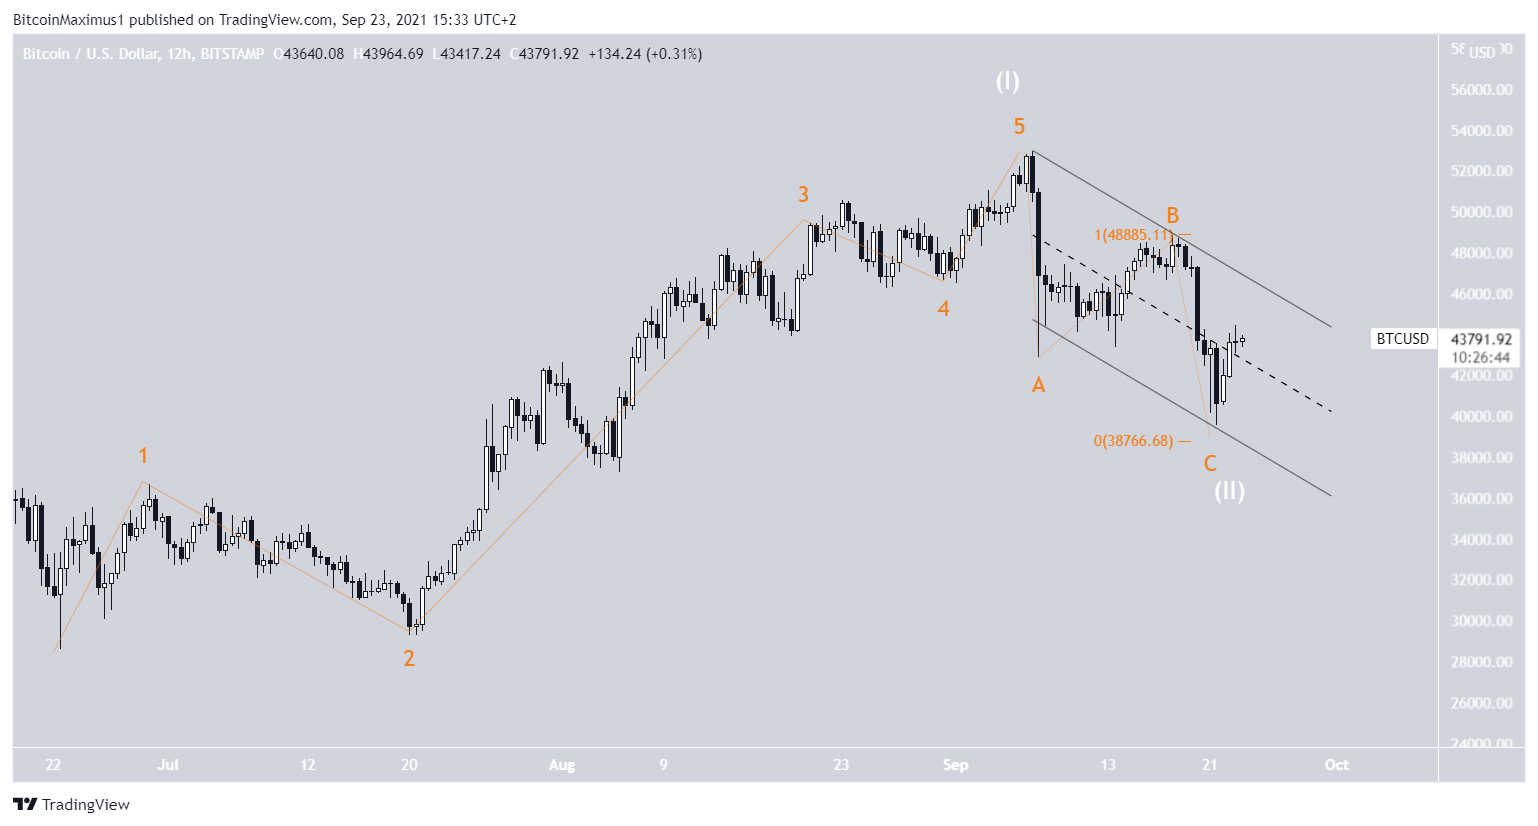
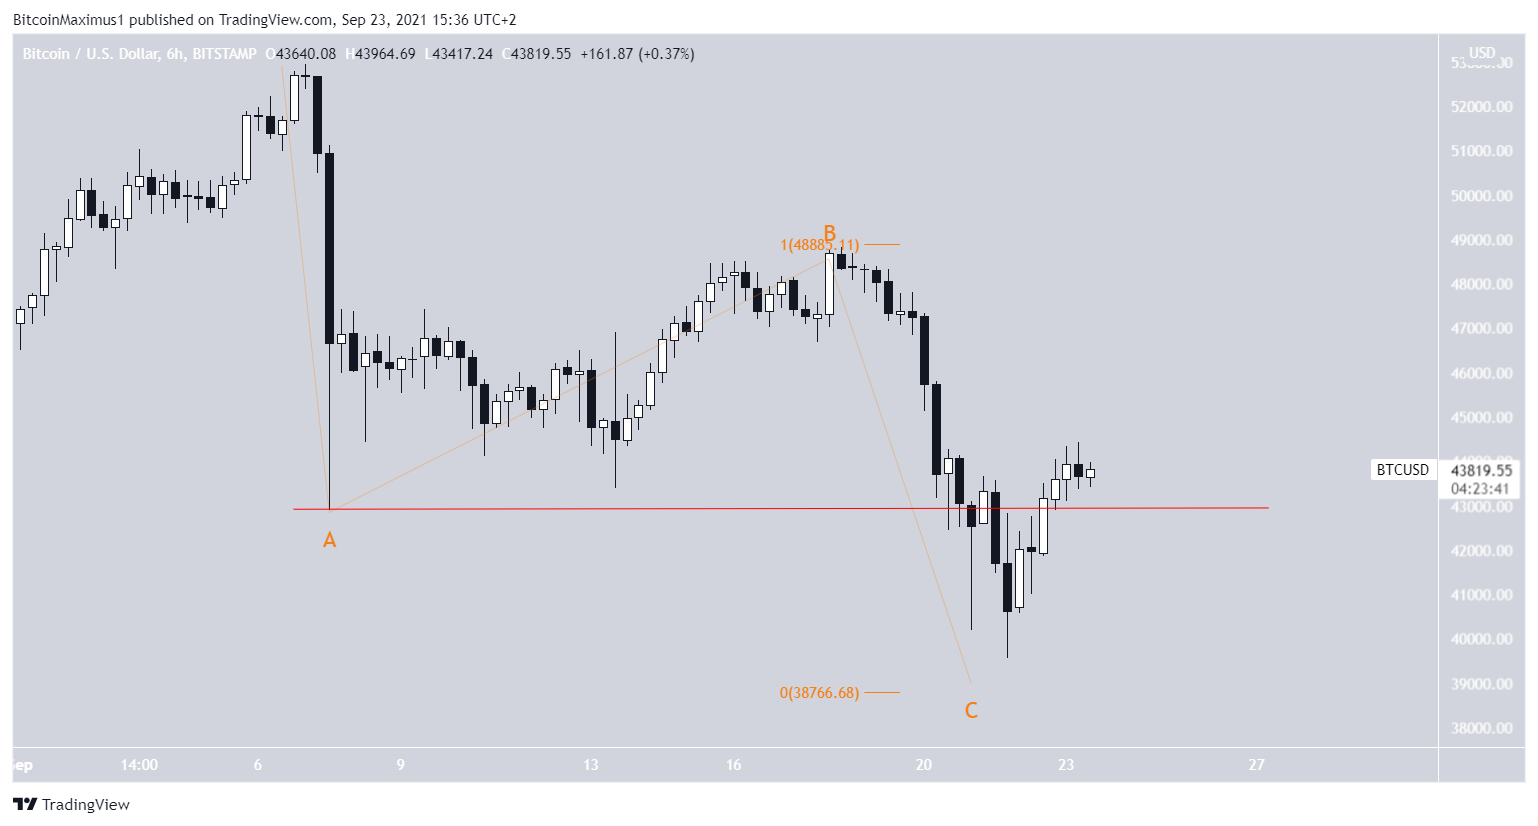
Bullish scenario for BTC. The only thing that can be stated now with full confidence, considering the dynamics of BTC in the framework of wave analysis – is that the decline from the historical maximum marked on April 14 (highlighted on the chart) is a five-wave bearish impulse structure. However, it remains unclear whether we are dealing with wave C (white color) or with the beginning of a new bearish impulse. According to the bullish scenario, this is wave C. Accordingly, a new impulse structure (white color) began on June 22. The decline since September 7 was part of wave 2. After that, the price rebound on September 22 probably marked the end of the correction. This version is supported by the fact that the rebound occurred directly in the area of the Fibo 0.5 correction level. The results of the sub-wave analysis are presented in orange. The above-mentioned decrease resembles a textbook example of the A-B-C correction structure taken from a textbook with the A:C wave ratio as 1:1. In addition, the price dynamics develops within the framework of a descending parallel channel. The growth of the BTC exchange rate above the minimum of wave one at $42,900 (red line) neutralizes a significant part of the potential bearish indicators. This will be incorrect only if we are dealing with a massive 1-2/1-2 structure, but this seems extremely unlikely. #CryptoTrading
No comments yet